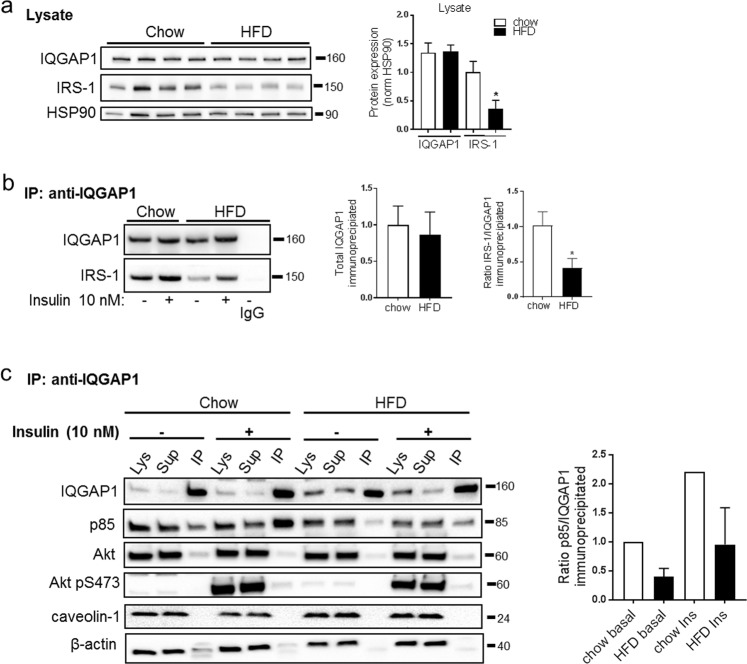
Figure 7.
(a) Representative western blots against IQGAP1 and IRS-1 in whole cell lysates, HSP90 used as loading control. Quantifications shown in graphs to the right, n = 4 independent experiments. (b) Isolated adipocytes obtained after chow or HFD-feeding of C57BL6/J mice, were pre-incubated with or without insulin (10 nM, 20 min) prior homogenization. Lysates were subjected to immunoprecipitation with anti-IQGAP1 antibody, followed by western blot analysis against IQGAP1 and IRS-1 in the immunoprecipitates. IgG used as a negative control. Quantification of total amount of IQGAP1 immunoprecipitated, and IRS-1 detected in immunoprecipitates are shown in graph to the right. n = 4 independent experiments. (c) Representative western blots against IQGAP1, p85, total and phosphorylated levels of Akt p(S473), caveolin-1 and actin in different fractions; the whole cell lysate (Lys), supernatant from the immunoprecipitation (Sup) and immunoprecipitates (IP). Quantification of IQGAP1 and p85 shown in graph to the right. Data presented as mean ± SD, *p ≤ 0.05.

