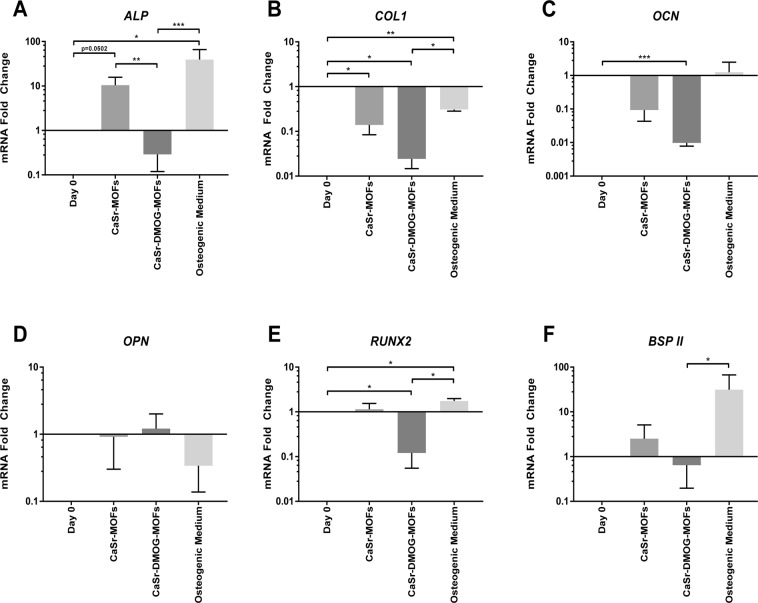
Figure 6.
Relative expression levels of mRNA transcripts for osteogenic genes in hMSC monolayers after treatment with MOFs. Results are shown after 14 days of treatment with CaSr-MOFs, CaSr-DMOG-MOFs, or osteogenic medium. (A–F) Expression of ALP, BSP II, RUNX2, OCN, OPN, and COL1. Expression levels are graphed on a log10 scale as fold changes normalized to day 0 baseline values and then to 18S rRNA levels (*p < 0.05, **p < 0.01, ***p < 0.001).

