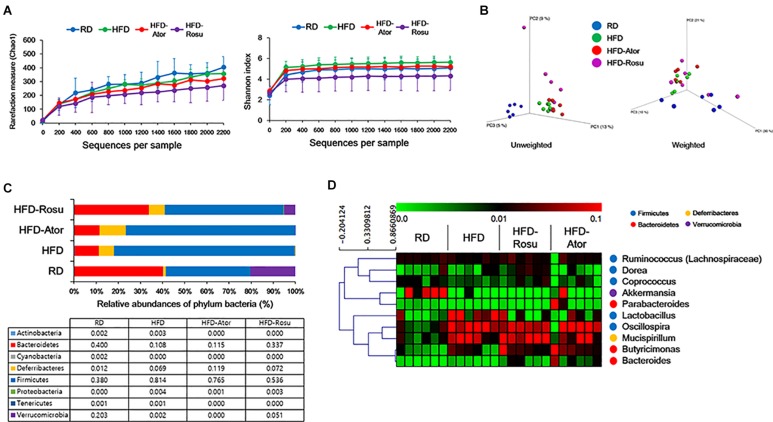
FIGURE 2.
Microbial diversity according to diet and statin therapy. (A) Rarefaction curve and Shannon index of bacterial diversity. (B) PCoA of UniFrac distances. (C) Bacterial classification at the phylum level. Table value indicates relative abundance of phylum level. (D) Heatmap of average linkage hierarchical clustering of the top 10 most abundant bacterial genera using Spearman’s rank correlation. A heat map was generated using MultiExperiment Viewer (MEV) software (v4.8.1). Rows represent bacterial genera, and columns represent samples.

