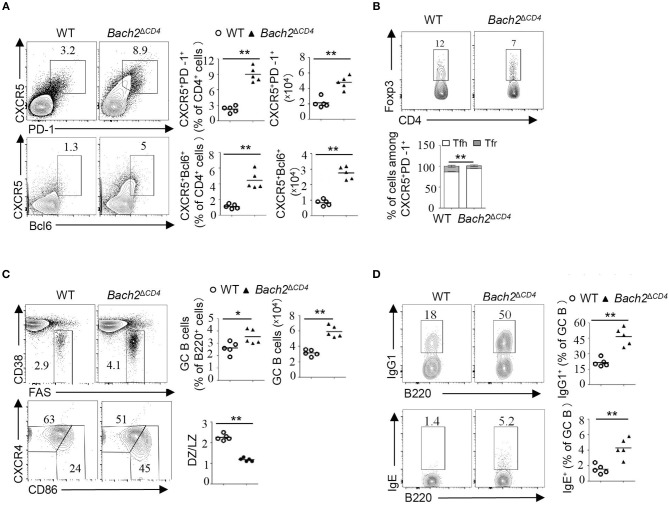
Figure 2.
Bach2ΔCD4 mice display excessive Tfh cells and aberrant GC B cells in the MLNs. Lymphocytes from the MLNs of WT and Bach2ΔCD4 mice at 2–3 months of age were subjected for analysis. (A) Representative flow cytometry plots, frequency quantification, and absolute number of CXCR5+PD-1+ and CXCR5+Bcl6+ T follicular cells (gated on CD4+B220− cells). (B) Representative flow cytometry plots and frequency quantification of Tfh (Foxp3−) and Tfr (Foxp3+) cells among CXCR5+PD-1+ CD4 T cells. (C) Representative flow cytometry plots, frequency quantification, and absolute number of CD38lo/−Fas+ GC B cells among splenic live B220+ cells. Quantification of the ratio of CD86hiCXCR4lo light zone (LZ) to CD86loCXCR4hi dark zone (DZ) B cells among GC B cells (bottom). (D) Representative flow cytometry plots and frequency quantification of IgG1+ and IgE+ cells among splenic GC B cells. All data were from at least two independent experiments. Each symbol represents one mouse, and small horizontal lines indicate the mean. ns, not significant; *P < 0.05 and **P < 0.01 (two-tailed t-test).

