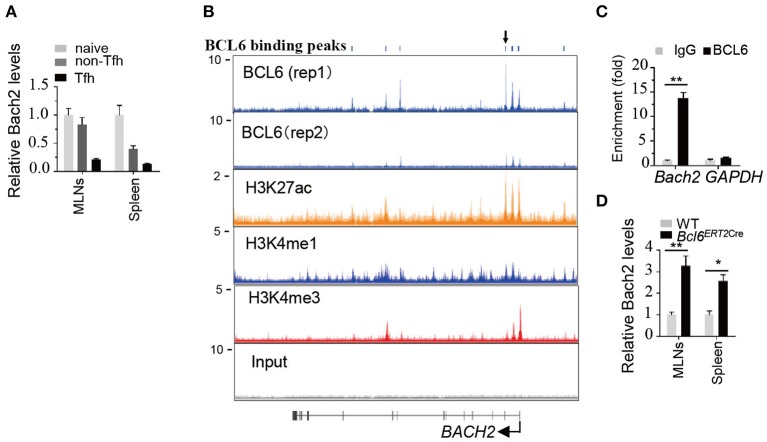
Figure 4.
Bach2 is down-regulated during Tfh cell differentiation and directly suppressed by BCL6. (A) Relative Bach2 mRNA abundance in naïve (CD44lowCD62Lhigh), non-Tfh (CD44highCD62LlowCXCR5−PD1−), and Tfh cells isolated from the MLNs and/or spleens of WT mice at 2 months of age, determined by RT-qPCR. (B) The illustration depicting ChIP-seq tracks of BCL6 and indicated histone marks at the BACH2 gene in primary human Tfh cells. BCL6 binding peaks are shown at the top. (C) ChIP-qPCR analysis of BCL6 binding peak indicated by arrow in (B). The fold enrichment was calculated relative to IgG. Data are mean ± s.e.m. (D) The relative mRNA expression levels of Bach2 in Tfh cells sorted from the MLNs and spleens of 2-month-old WT and Bcl6ERT2Cre mice 5 days post tamoxifen treatment. Data are mean ± s.e.m. of two mice per group. *P < 0.05 and **P < 0.01 (two-tailed t-test).

