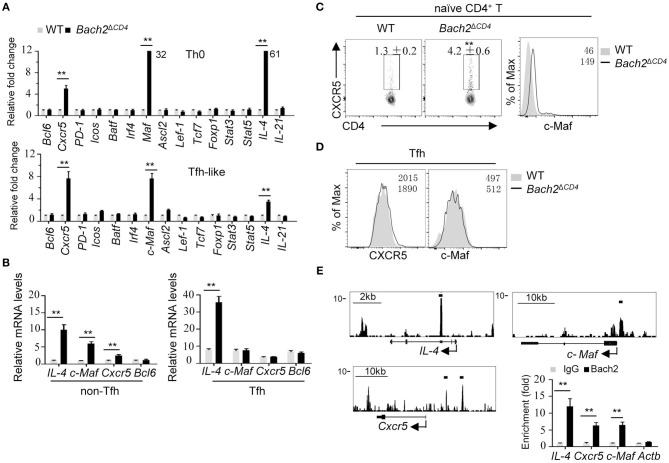
Figure 5.
Bach2 negatively regulates the mRNA abundance of Cxcr5, Maf, and IL-4. All cells were isolated from 2-month-old mice for analysis. (A) Relative mRNA levels of indicated genes in splenic naïve CD4+ cells (CD44lowCD62Lhigh) cultured in Th0 or Tfh-like cell condition. Data were from two independent experiments and represented as fold changes relative to WT cells after normalization with Actb. Numbers adjacent to black bars indicate fold in each. (B) RT-qPCR analysis of mRNA levels of indicated genes in WT and Bach2-deficient non-Tfh (CD44highCXCR5−PD1−) and Tfh cells. Data were represented as up-regulation relative to WT non-Tfh cells after normalization with Actb. (C) The frequency of CXCR5+ cells and c-Maf protein abundance in naïve CD4+ T cells from the MLNs. (D) Flow cytometric analysis of CXCR5 and c-Maf protein abundance in Tfh cells. (E) The illustration of ChIP-seq tracks of Bach2 at indicated genes in CD4+ T cells (left). Bach2-bound sites were indicated by black lines. ChIP-qPCR analysis of Bach2 binding at indicated genomic loci. The fold enrichment was calculated relative to IgG. Data are mean ± s.e.m. of two independent experiments from at least three mice per group. **P < 0.01 (two-tailed t-test).

