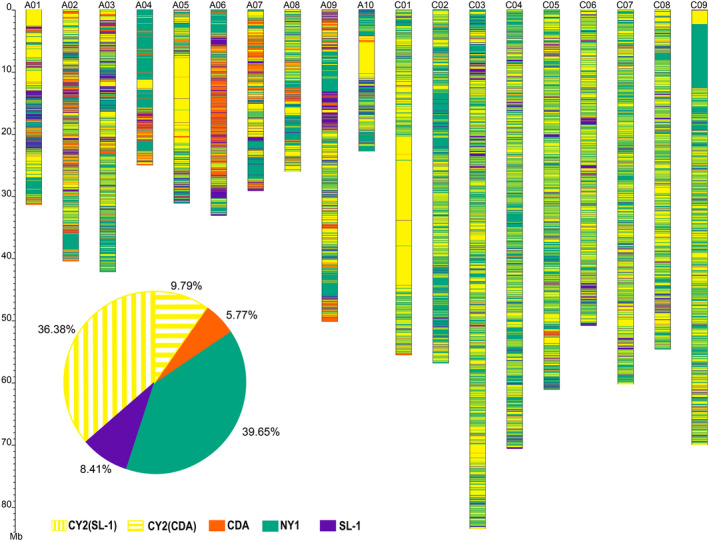
Figure 5.

Identity‐by‐descent (IBD) inheritance pattern for the NY7 pedigree. For each chromosome, the genomic contributions by the four different parental lines to NY7 were colour‐coded as CY2 (yellow), CDA (orange), NY1 (green) and SL‐1 (purple). The accumulated percentages of genomic contribution by the four parental lines are shown in the pie graph. The genomic contribution of CY2 to NY7 was further divided into those from SL‐1 (36.38%) and CDA (9.79%).
