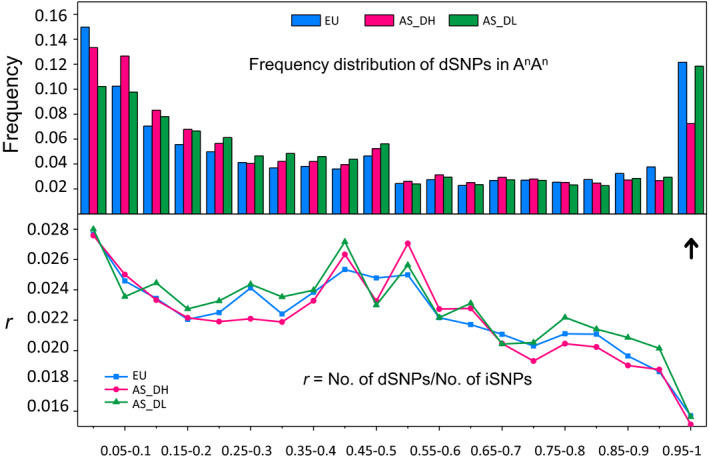
Figure 6.

Genetic load estimation for the European and Asian groups. The top panel shows the frequency distribution of deleterious SNPs (dSNPs) in the A subgenome of European (EU) and two Asian groups (AS_DH and AS_DL) with the arrow indicating the fixed dSNPs (with a frequency of 0.95‐1 in the target population). The bottom panel illustrates the relative frequency of deleterious to neutral variants (iSNPs) in the three groups.
