
Figure 1.
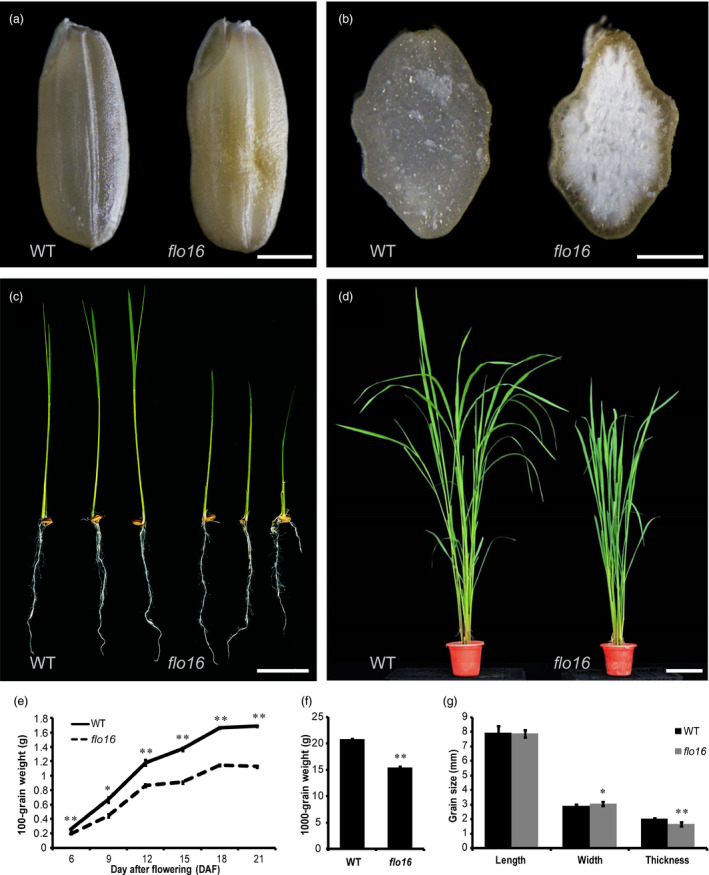
Phenotypes of the flo16 mutant. (a) Images of mature seeds of wild type (left) and flo16 (right). Scale bar, 2 mm. (b) Cross sections of the mature seeds of wild type (left) and flo16 (right). Scale bar, 1 mm. (c) One‐week‐old seedlings of wild type (left) and flo16 (right). Scale bar, 4 cm. (d) Wild type (left) and flo16 (right) plants at the booting stage. Scale bar, 20 cm. (e) Grain weights of wild type and flo16 at various stages post‐fertilization. Grain weight indicates the weight of 100 dehulled dry grains, values are means ± SD, n = 3. (f) 1000‐grain weights of wild type and flo16. Values are means ± SD, n = 5. (g) Grain size comparisons between wild type and flo16. Values are means ± SD, n = 10. Asterisks indicate the statistical significance between the wild type and mutants determined by Student's t‐tests (*P < 0.05; **P < 0.01).