Figure 5.

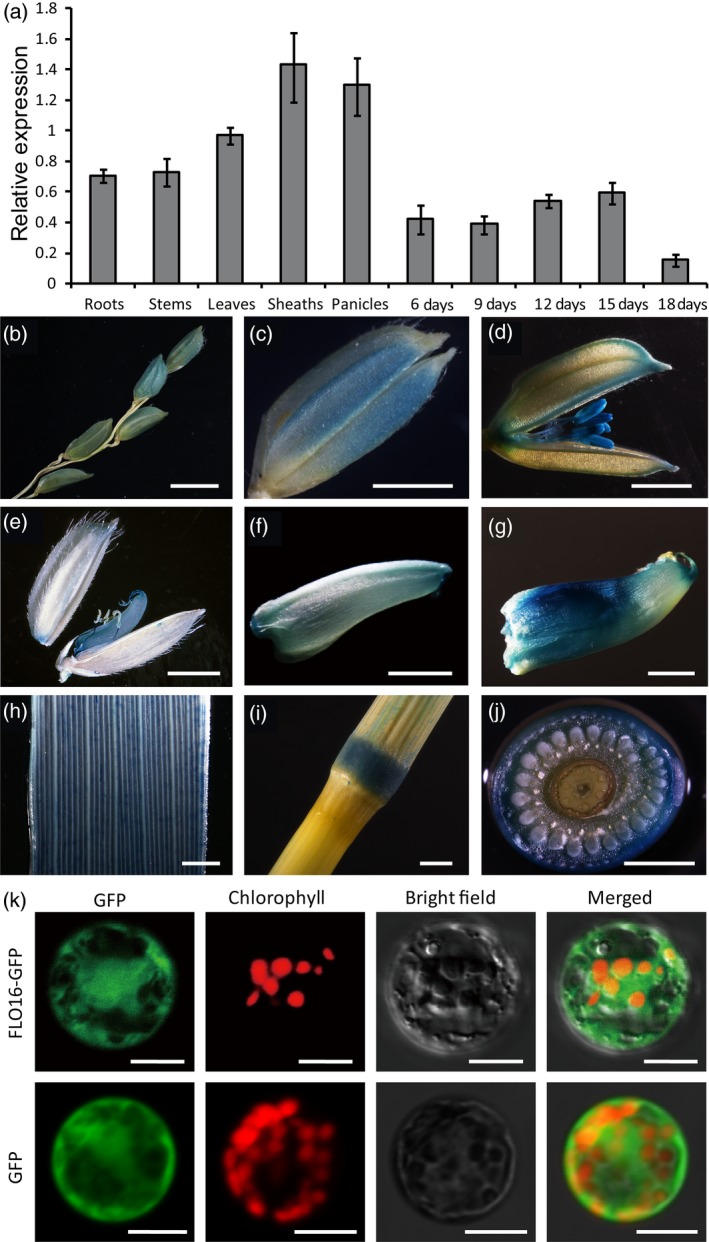
Spatial expression patterns of FLO16. (a) Expression levels of FLO16 in various tissues. Developing seeds were sampled at 6, 9, 12, 15 and 18 days after flowering (DAF), and other tissues were sampled at heading. The value of Actin I mRNA was used as an internal control for data normalization. Values are means ± SD, n = 3. (b‐g) GUS activity in panicles (b), spikelet before heading (c), during heading (d), and at 3 DAF, and grains at 3 (e), 6 DAF (f) and 9 DAF (g), leaf (h), node (i, j). (j) Cross section of the node in (i). Scale bars, 10 mm in (b), 2 mm in (c‐j). (k) Subcellular localization of FLO16. Free GFP served as a control (lower panel). The fusion construct FLO16‐GFP was expressed in the rice protoplasts (upper panel). Green fluorescence signals, red chlorophyll autofluorescence, and bright field and merged images are shown in each panel. Scale bars, 10 μm.
