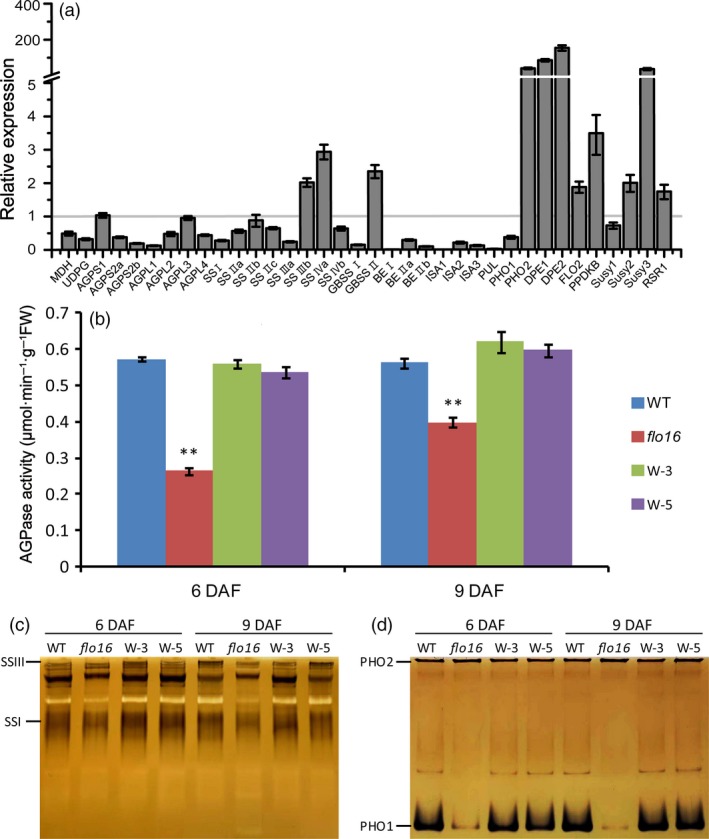
Figure 7.

Gene expression and protein activity analyses of starch synthesizing enzymes. (a) Expression levels of starch synthesis‐related enzymes in developing endosperm 10 DAF. Data represent ratios of expression levels in flo16 to that of wild type. Values are means ± SD, n = 3. (b) AGPase activities in developing endosperm of wild type and flo16. Values are means ± SD, n = 3. Asterisks indicate the statistical significance determined by Student's t‐tests (*P < 0.05; **P < 0.01). (c) Activity bands for SSI, and SSIII. (d) Activity bands for PHO1 and PHO2.
