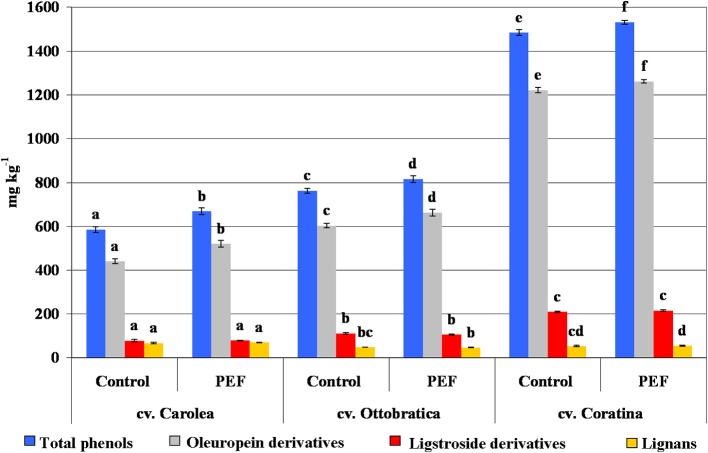
Figure 4.
Phenolic composition (mg kg−1) of the PEF and control EVOOs of the three different Italian olive cultivars. Phenolic content was expressed as total phenols, oleuropein derivatives (sum of 3,4-DHPEA, 3,4-DHPEA-EDA, and 3,4-DHPEA-EA), ligstroside derivatives (p-HPEA, p-HPEA-EDA and ligstroside aglycone) and lignans [sum of (+)-1-acetoxypinoresinol and (+)-pinoresinol]. The data are the mean values of three independent extractions analyzed in duplicate, ± standard deviation. The values of each phenolic group with different letters (a–f) are significantly different from one another (p < 0.05).

