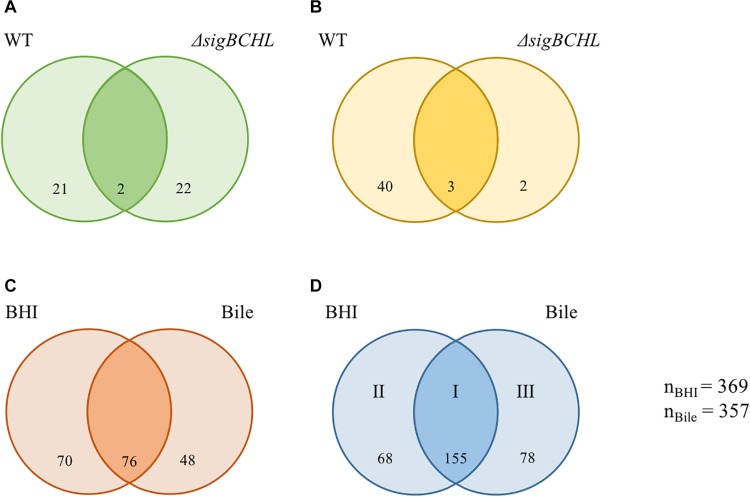
FIGURE 2.
Venn diagrams showing the overlaps of differentially expressed genes (DEGs) of L. monocytogenes wild type and ΔsigBCHL under bile exposure compared to BHI. (A,B) Numbers of genes with significantly decreased and increased transcripts after exposure to bile, respectively. (C,D) Numbers of genes under σA regulation with significantly lower and higher levels in ΔsigBCHL in comparison to wild type, respectively. Differentially expressed genes in BHI and bile conditions are shown in left and right circles, respectively. The number indicated in the circle represents the number of differentially expressed genes in each strain and condition. I, II, and III represent groups of genes positively regulated by σA. The total numbers of differentially expressed genes under BHI and bile calculated from either lower or higher level are 369 and 357, respectively.

