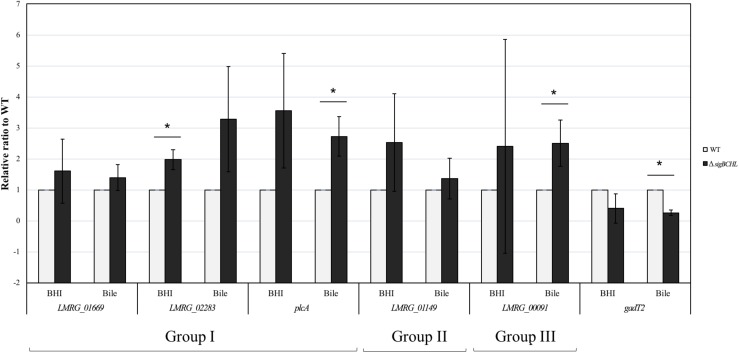
FIGURE 3.
Confirmation of DEGs by TaqMan qPCR. Transcript levels were quantified in up-regulated sets of genes i.e., Group I (LMRG_01669, LMRG_02283, and plcA), Group II (LMRG_01149), and Group III (LMRG_00091) and in down-regulated gene (gadT2). Wild type transcript levels are in gray and ΔsigBCHL transcript levels are in black. Transcript levels are expressed relative to WT after normalization to geometric mean of housekeeping genes, rpoB and bglA (Supplementary Table S7). Experiments were performed in biological triplicates. Asterisk indicates significance fold difference relative to wild type.

