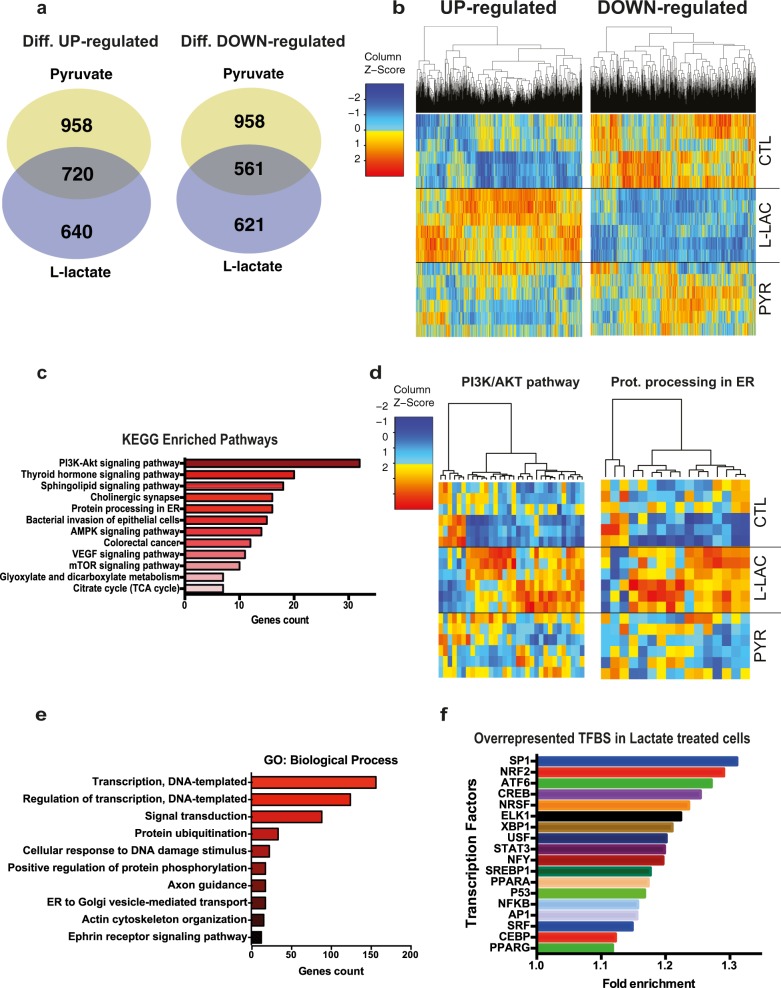
Fig. 2. RNA sequencing of SH-SY5Y cells revealed enrichment in key growth-survival pathways.
a Venn diagram showing the overlap between the numbers of significant differentially up- and down-regulated genes compared to control by lactate and pyruvate. SH-SY5Y cells were treated for 6 h with 20 mM lactate or pyruvate. The cut-off for significance was p < 0.01. b Heat map clustering of genes differentially regulated by lactate, compared to control and pyruvate-treated cells. The map represents expression levels of each transcript (count per million), and z-score represents a normalized expression of each transcript across the different conditions. c KEGG pathways over-representation analyses. Significantly enriched pathways (p-value < 0.05) are ranked by genes count d Heatmap clustering for KEGG-PI3K/AKT and KEGG-Protein processing in ER. Each map represents the list of genes specifically regulated by lactate and associated with PI3K/AKT or Protein processing in the ER. The map represents expression levels of each transcript (count per million), and z-score represents a normalized expression of each transcript across the different conditions. e Biological processes GO terms ranked by genes count (p-value < 0.05). f Sublist of DAVID over-representation of Transcription factors binding sites curated for metabolism and stress resistance signaling, associated with differentially expressed genes by lactate. Significantly enriched transcription factors are ranked by fold enrichment

