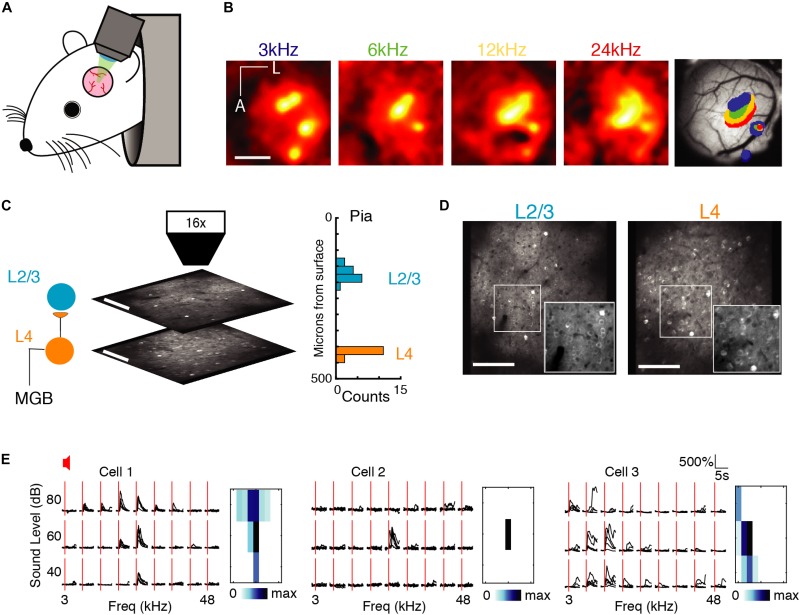
FIGURE 1.
Imaging A1 population activity in the awake mouse. (A) Cartoon of awake mouse under the microscope. (B) Wide-field functional imaging identifies A1. Average activation maps from four different sound frequencies and thresholded activity overlaid on image of brain surface. Tonotopic gradient indicates location of A1. Scale bar = 1 mm. (C) Imaging L4 and L2/3. Histogram shows distribution of imaging plane depths across all experiments. (D) Representative fields of view from L2/3 (left) and L4 (right) showing GCaMP6s expression present in both layers. Scale bar: 100 μm. (E) Sound-evoked intracellular calcium responses for three pyramidal neurons in A1 to nine different frequencies (column), and three sound levels (row). Each black line indicates a single trial; five repeats per condition, red line indicates sound stimulus onset. Right: Frequency response areas.

