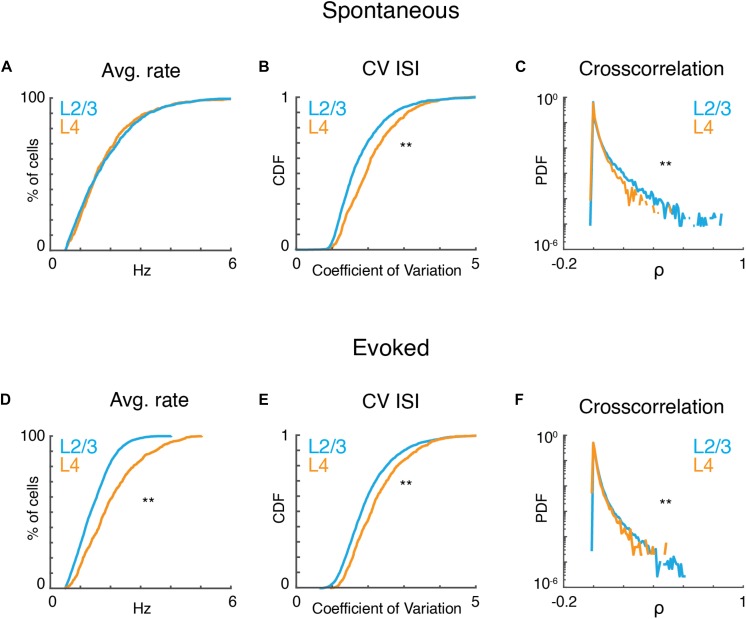
FIGURE 2.
A1 activity is variable and correlated. (A) Cumulative probability distributions of average spike rate for all recorded neurons in L2/3 (blue) and L4 (orange) during ongoing activity (prate > 0.84, ranksum). (B) Corresponding cumulative probability distribution of inferred CV inter-spike interval (CVISI) for all neurons in L4 (orange) and L2/3 (blue) (pCV < 10–20, ranksum). (C) Probability distribution of pairwise cross-correlation values for all neurons and experiments for L4 (orange) and L2/3 (blue) (pCC < 10–65, ranksum). (D–F) Average spike rate, CVISI, and pairwise cross-correlation for evoked neuronal activity (prate < 10–55, pCV < 10–20, pCC < 10–301, ranksum).

