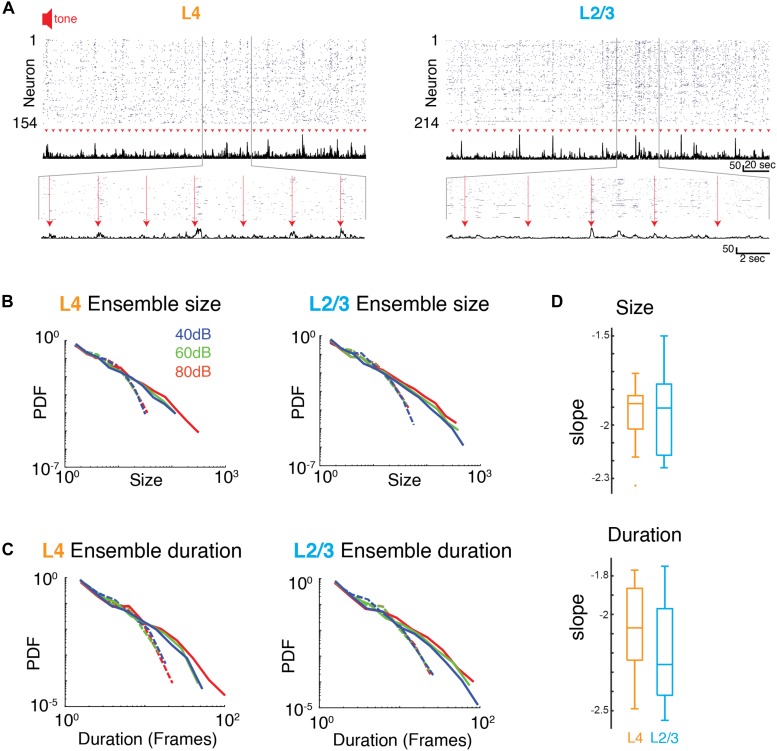
FIGURE 4.
Neuronal ensembles in A1 during ongoing activity organize as neuronal avalanches. (A) Activity raster of simultaneously recorded L4 (left) and L2/3 (right) neurons to brief auditory inputs (arrow heads). Middle: Corresponding population activities summed over all neurons. Bottom: Enlarged views revealing variable, transient evoked responses. (B,C) Probability density distributions of ensemble sizes and ensemble duration reveal power laws for the evoked responses and different sound intensity in L4 (left) and L2/3 (right). Dashed lines indicate probability density distributions from shuffled data sets. (D) Boxplots showing slopes of probability distributions in ensemble size (top) and ensemble duration (bottom) for each individual experiment in L4 (orange) and L2/3 (blue), Size: αL2/3: –1.93 ± 0.25, αL4: –1.95 ± 0.20, Duration: αL2/3: –2.20 ± 0.26, αL4: –2.08 ± 0.25, mean ± SD; psize > 0.84, pdur > 0.29, unpaired two-sample t-test.

