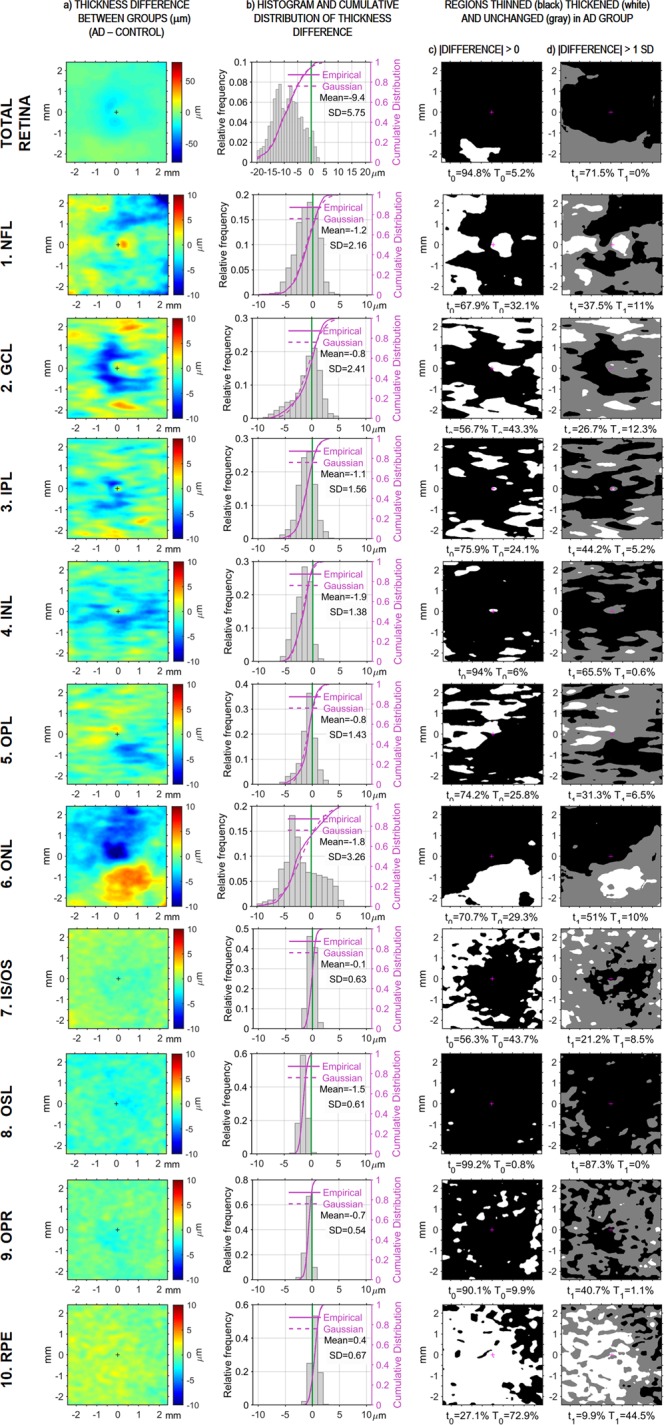
Figure 3.

AD-related thinning and thickening of retinal layers. The top row shows data for the total retina; subsequent rows show data for each of its layers. (a) The first column shows the color-coded thickness difference between patients and controls for each scanned retinal point. (b) The second column displays the histogram and the cumulative distribution function for all those differences, together with its mean and SD. (c) The third column shows the regions where layers are thinner (black) or thicker (white) in patients, irrespective of the size of the difference. (d) The right-most column shows thinner (black) and thicker (white) regions where the difference >1 SD; regions with a smaller difference appear in gray. The two values collected under each image of the two right-most columns refer to the percentages of thinned (t) and thickened (T) areas in the image above.
