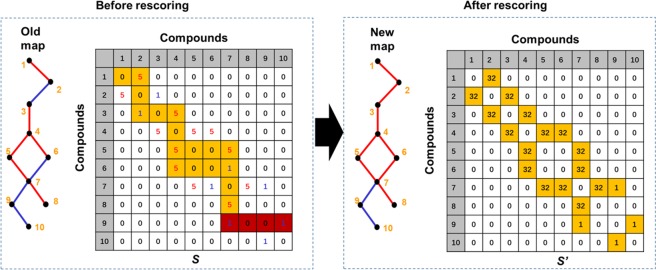
Figure 5.
Link missing essential genes in pathway. An illustrative example of the ‘remapping’ algorithm processed on the KEGG pathway map with 10 hypothetical compounds. The left panel represents the map and matrix (S) before the rescoring. In the old map (left panel), the blue edges are non-essential genes, while the red ones are essential genes. The elements in the matrix (S) show the existence and essentiality of the reaction between the two corresponding compounds. The colored elements highlight how the DFS algorithm searches for the linked edges for the first edge. The yellow boxes are the linked edges and the red boxes are the discarded edges. The right panel shows the new map and the updated matrix (S’). Note that in the new map, edges (2–3) and (6–7) are considered as the missing EGs and are labeled red. The S’ provides the final score for each edge, which serves as the basis for EG determination.

