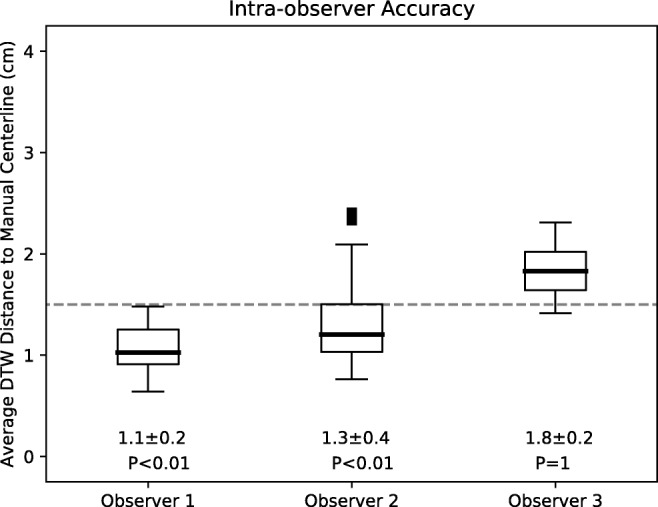
Fig. 5.

Accuracy as represented by the average DTW distance of the visually annotated centerlines to the manually annotated centerlines. Each boxplot represents all annotations done by a single observer. The dashed line represents the 1.5 cm distance specified as acceptable for accuracy. Mean ± standard deviations as well as P values shown below. P values correspond to statistical difference between data and the 1.5 cm distance
