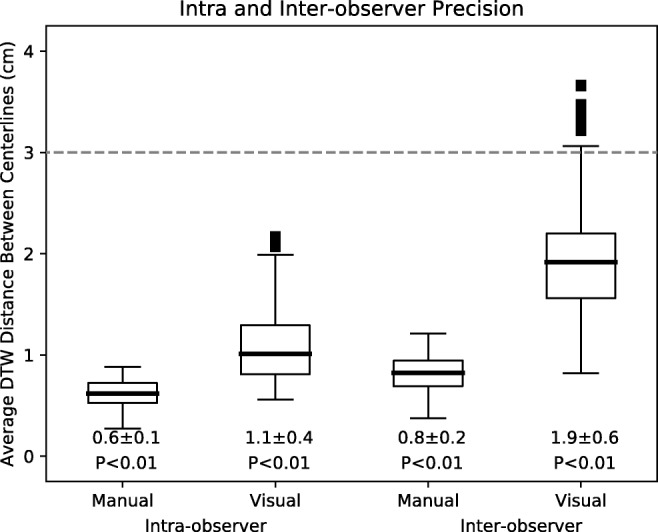
Fig. 6.

Intra- and inter-observer variability for manual and visual centerline annotations as a metric for precision. Each boxplot represents data from all cases and observers for the two annotation types. The dashed line represents the 3.0 cm distance specified as acceptable for precision. Mean ± standard deviations as well as p-values shown below. P values correspond to statistical difference between data and the 3.0 cm distance
