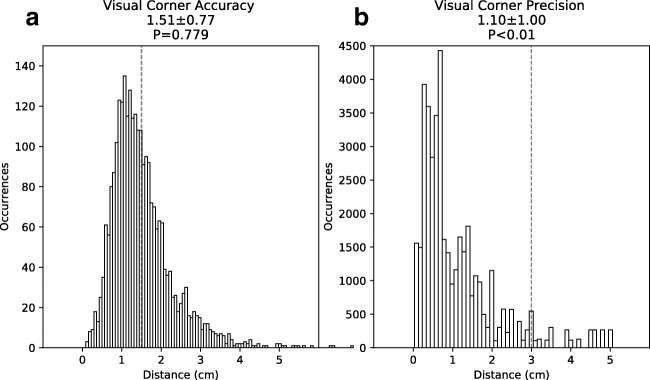
Fig. 7.
Histogram representation of the accuracy and precision analysis of the visually annotated corner points. Panel a represents the distribution of the radial distances between visually annotated corner points and the corner markers. Dashed red line represents 1.5 cm. Panel b represents the distribution of distances between visually annotated corner markers in the first and last CT slice of the small-bowel segments. Dashed line represents 3.0 cm

