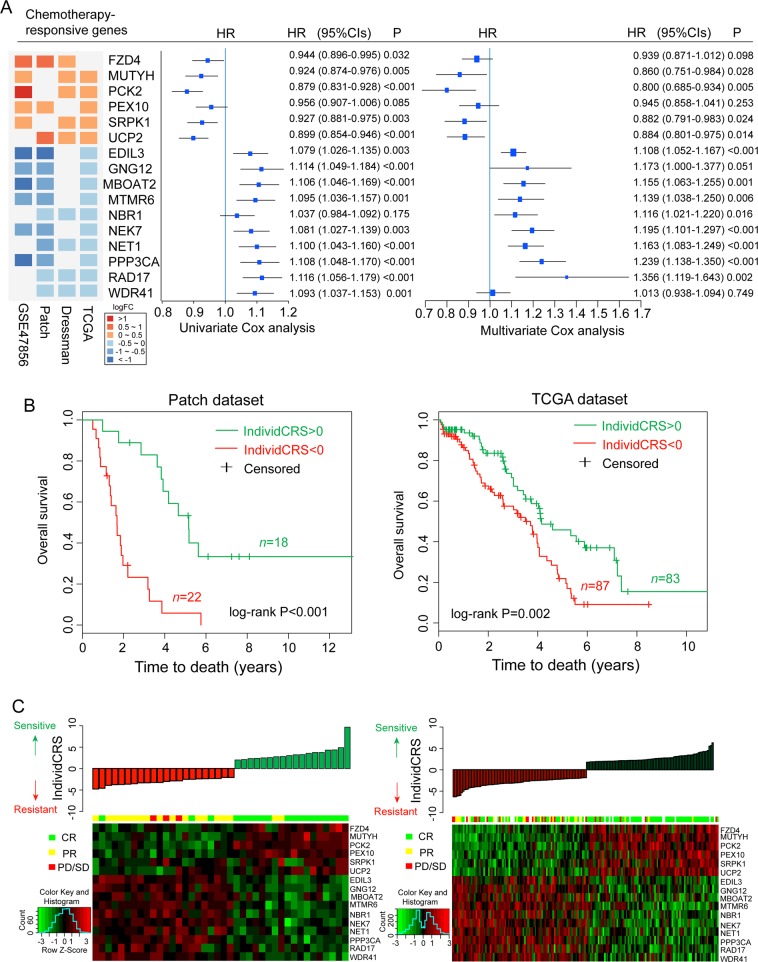
Fig. 1. Development of a 16-gene signature.
a Forest plot illustrating the Hazard ratios (HRs) of fixed-effect meta-analysis summary result for each of the 16 chemotherapy-responsive genes. The HR shown for each gene is leveraged from univariate and multivariate Cox-PH analysis across 21 ovarian cancer cohorts. Colored rectangles on the left indicate the logFC of gene expression comparing chemo-sensitive to chemo-resistant tumors. b Kaplan–Meier curves of OS for patients divided by the IndividCRS in the Patch and TCGA datasets. Significance was determined using the log-rank test. c Distribution of the IndividCRS and expression heatmap of 16 chemotherapy-responsive genes in the Patch and TCGA datasets. HR, hazard ratio; OS, overall survival; IndividCRS, individual chemotherapeutic response scores; TCGA, The Cancer Genome Atlas Network; CR: Complete response; PR: partial response; PD: progression disease; SD: stable disease

