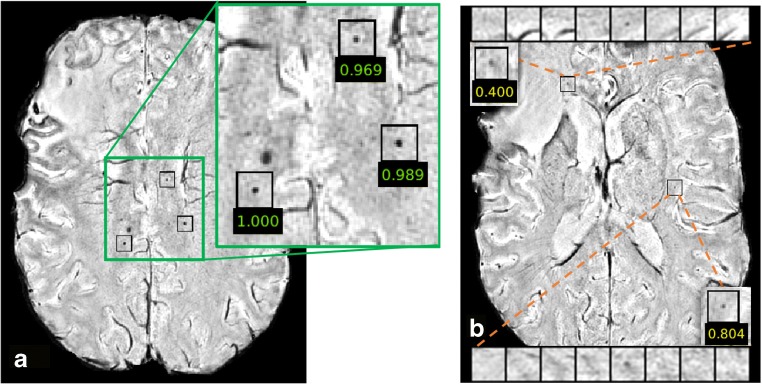
Fig. 4.
Likelihood scores of representative candidates from the test set overlaid on SWI slices. a shows the three correctly identified CMBs by the network with high likelihood scores close to one, while b demonstrates two remaining FPs with lower likelihood scores. Since the classification threshold was empirically selected to be 0.1 instead of 0.5 as in most tasks to maintain high sensitivity, the candidate with likelihood score of 0.4, which would have been correctly classified if we use the usual 0.5 threshold, was mistakenly classified as CMB by the network

