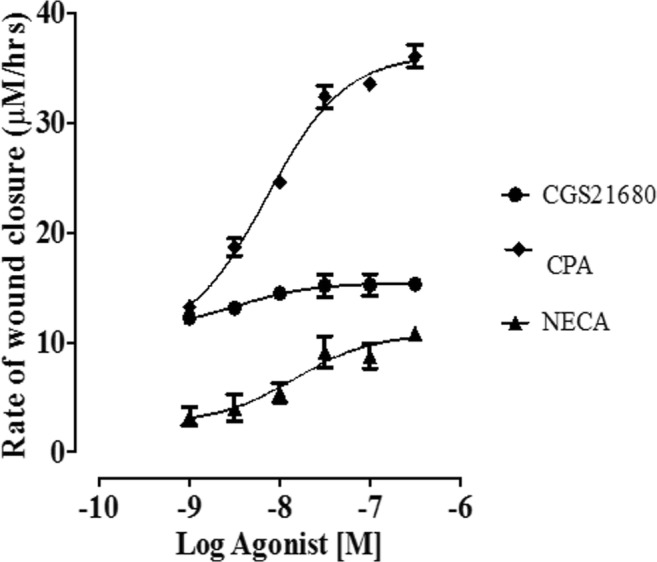
Fig. 3.

Concentration-response curves (CRC) showing the effect of selective adenosine receptor agonists on EA.hy926 endothelial cells and the rate of wound healing, n = 6 per group. Note that NECA concentration-response curves were done in the presence of 10 nM ZM241385
