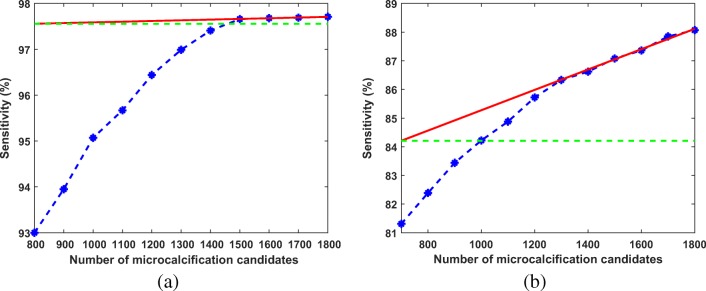
Fig. 7.
A plot of sensitivity of individual microcalcifications versus number of microcalcification candidates. The red line is fitted using the last three points in the plot. The green line is the reference line for measuring the angle of inclination of the red line a for DDSM and b for PGIMER-IITKGP database

