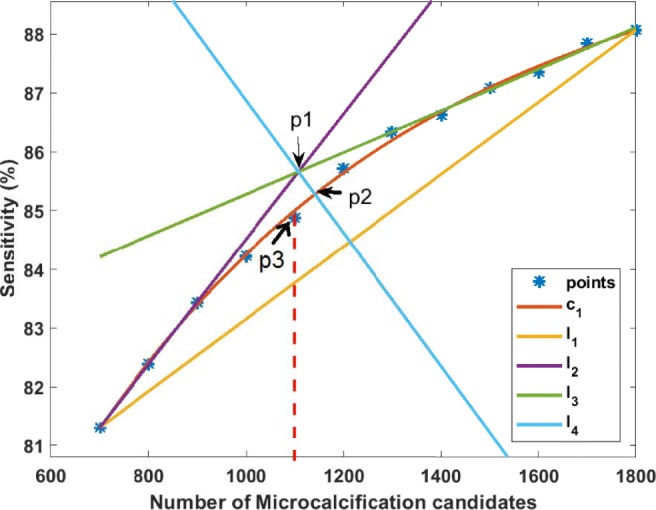
Fig. 8.

This figure shows plot of sensitivity of individual microcalcifications versus number of microcalcification candidates for PGIMER-IITKGP database. This figure also shows how to find out the knee point (p2) and the nearest point (p3) indicating the number of microcalcification candidates which should be selected for 100% sensitivity
