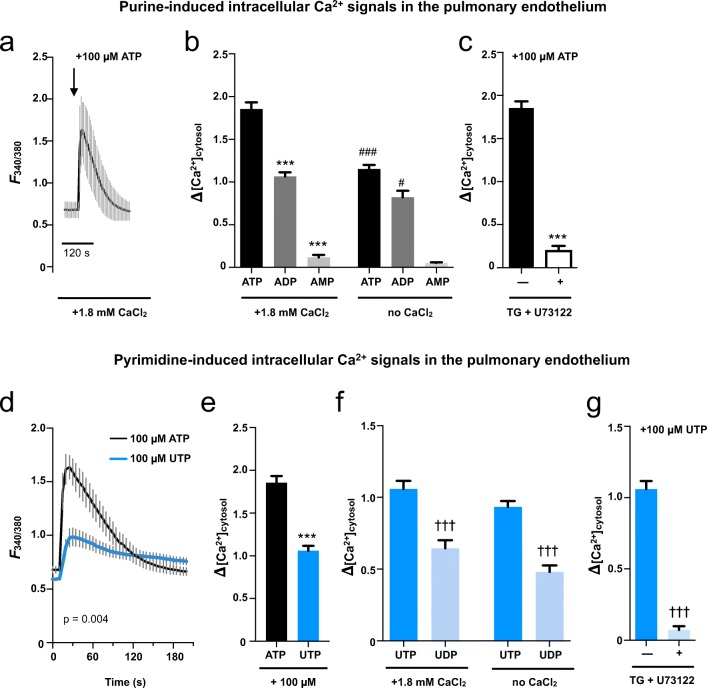
Fig. 3.
Functional expression of the P2-receptor Ca2+ signalosome in human pulmonary artery endothelial cells. Purine- (a–c) and pyrimidine-induced (d–g) intracellular Ca2+ signals in HPAEC measured by single cell FURA-2 fluorescence. a Representative fluorescence tracings of ATP treated HPAEC are given (n = 9). b Quantification of peak purine-induced cytosolic Ca2+ signals upon stimulation with 100 μM ATP (black bar), ADP (dark gray bar), and AMP (light gray bar) under physiological extracellular Ca2+ concentrations (left bars) or in a Ca2+ free extracellular buffer (right bars). c Peak fluorescence of HPAEC upon stimulation with 100 μM ATP without (black bar) or after depletion of intracellular Ca2+ stores by combined use of thapsigargin (TG) and PLC inhibitor U73122 (open bar). d Representative tracings of ATP treated (n = 9) vs. UTP-treated HPAEC (n = 12) under physiological extracellular Ca2+ conditions (p = 0.004, Welch’s t test). e Quantification of peak Ca2+ responses to ATP and UTP (100 μM each) under physiological extracellular Ca2+ (ECS + Ca2+). f Quantification of peak pyrimidine-induced cytosolic Ca2+ signals upon stimulation with 100 μM UTP (dark blue bar) and UDP (light blue bar) under physiological extracellular Ca2+ concentrations (left bars) or in a Ca2+-free extracellular buffer (right bars). g Peak fluorescence of HPAEC upon stimulation with 100 μM UTP without (dark blue bar) or after depletion of intracellular Ca2+ stores by combined use of thapsigargin (TG) and PLC inhibitor U73122 (light blue bar). *** = p < 0.0001 vs. ATP; ###,# = p < 0.0001; p < 0.05 vs. corresponding ECS + Ca2+; ††† = p < 0.0001 vs. corresponding UTP; (b) + (f): ANOVA with Bonferroni post-hoc test (c–e) + (g) Welch’s t test

