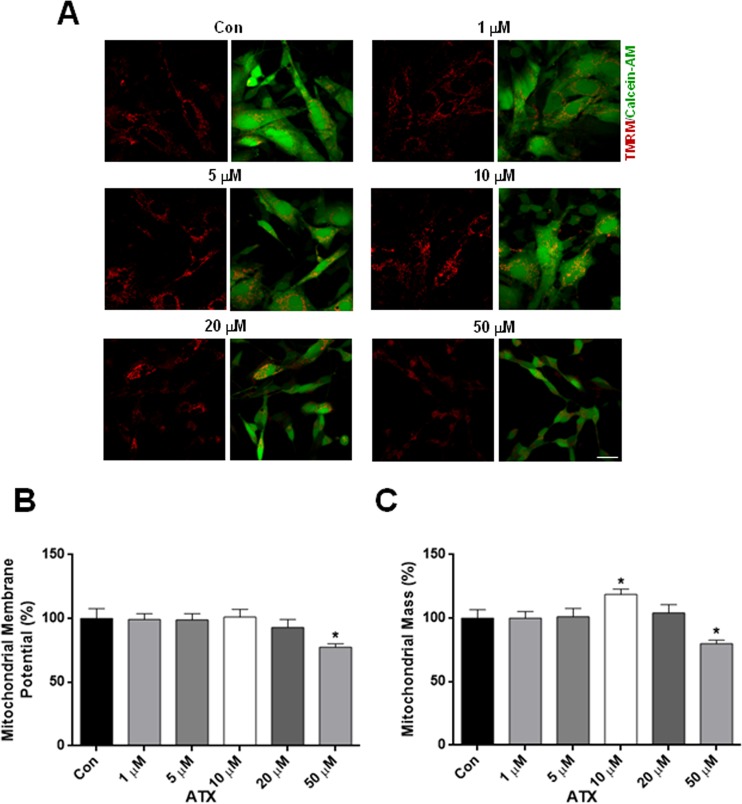
Figure 3.
ATX altered ΔΨm and mass in human neuron-like cells. (A) Representative confocal images of ΔΨm, were measured by the retention of TMRM (red) and mitochondrial mass which was calculated from the images using calcein-AM (green) to define the cytosol. (B) Quantification of ΔΨm and (C) mitochondrial mass. Data are mean ± SEM, and values are from five independent experiments. *P < 0.05 compared to the control group. Scale bar = 10 μm.

