
Figure 4.
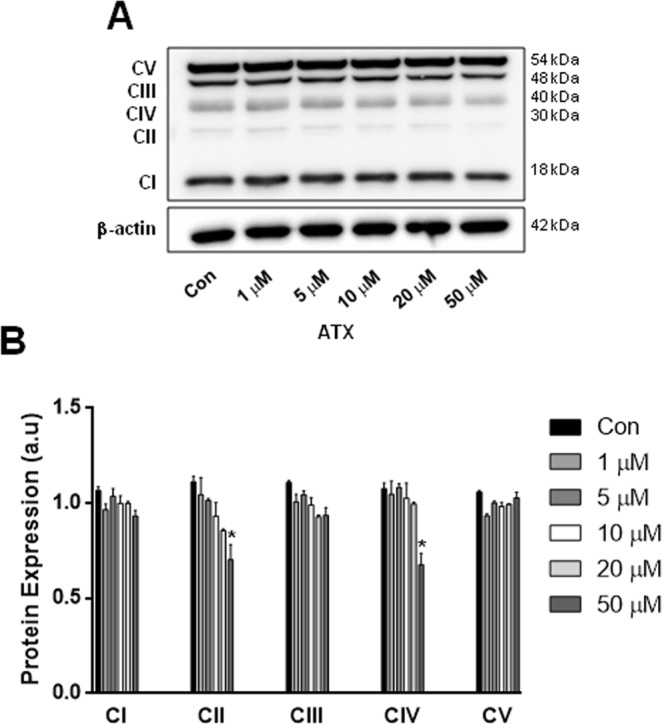
ATX altered mitochondrial OxPhos complexes. (A) Representative western blot. (B) Quantification of western blot analysis of mitochondrial OXPHOS complexes in neuron-like cells treated with different concentrations of ATX. β-actin was used as a loading control. Data are mean ± SEM, and values are from three independent experiments. *P < 0.05 compared to the control group. For clarity of the results, the representative Western blots are cropped, for raw data see Supplementary Information.