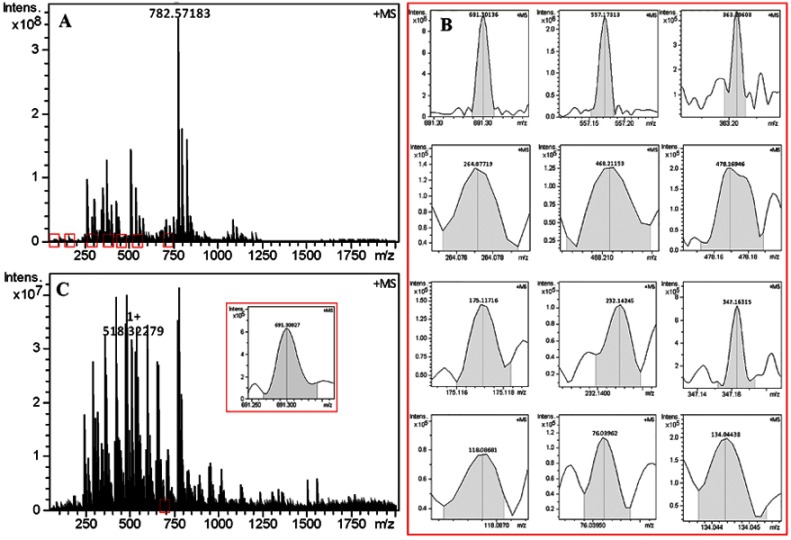
Figure 11.
FT(+)-MS spectrum of the extract of the homogenate of tumor tissue and blood of S180 mice treated with 8.4 μmol/kg/day of RGDV-gemcitabine. (A) FT(+)-MS spectrum of the extract of the homogenate of the tumor tissue; (B) locally amplified spectra of Arg-Gly-Asp-Val plus H at 468.2117, Arg-Gly-Asp plus H at 347.1631, Arg-Gly plus H at 232.1424, Arg plus H at 175.1176, Gly plus H at 76.0396, Asp plus H at 134.0443, Val plus H at 118.0868, RGDV-gemcitabine plus H at 691.3013, GDV-gemcitabine plus Na at 557.1737, DV-gemcitabine plus H at 478.1694, V-gemcitabine plus H at 363.2060 and gemcitabine plus H at 264.0771; (C) FT(+)-MS spectrum of the extract of the homogenate of the blood and amplified spectrum of RGDV-gemcitabine plus H at 691.3002.
Abbreviations: RGDV-gemcitabine, 4-[Arg-Gly-Asp-Val-amino-1-[3,3-difluoro-4-hydroxy-5- (hydroxylme-thyl)oxolan-2-yl]pyrimidin-2-one; GDV-gemcitabine, 4-[Gly-Asp-Val-amino-1-[3,3-difluoro-4-hydroxy-5-(hydroxylme-thyl)oxolan-2-yl]pyrimidin-2-one; DV-gemcitabine, 4-[Arg-Gly-Asp-Val-amino-1-[3,3-difluoro-4- hydroxy-5-(hydroxylme-thyl)oxolan-2-yl]pyrimidin-2-one.

