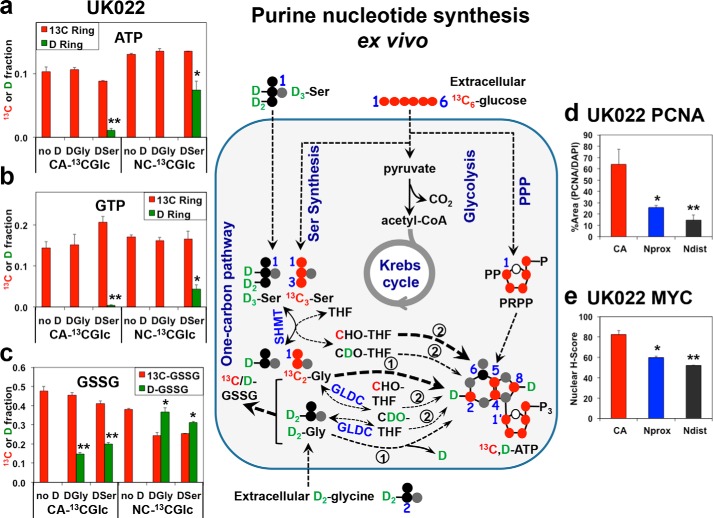
Figure 2.
Glucose is a preferred substrate over exogenous serine and glycine for fueling purine synthesis in human cancerous lung tissues ex vivo. Freshly resected and thinly cut lung tissue slices (in 2–3 replicates) from NSCLC patient UK022 were treated with [13C6]glucose (13C Glc), [13C6]Glc + D3-Ser (DSer), or [13C6]Glc + D2-Gly (DGly) for 24 h. The tissue slices were then harvested, processed, and analyzed for 13C and D enrichment in ATP (a), GTP (b), and GSH disulfides (GSSG) (c) by direct infusion UHR-FTMS, and for nuclear localization of PCNA (d) and MYC (e) by immunohistochemical staining, as described under “Experimental procedures.” Also shown in the middle panel is the 13C (red circle) and D (green circle) atom tracking from the [13C6]Glc, D2-Gly (DGly), or D3-Ser (DSer) precursors to the adenine ring in ATP via glycolysis, Ser synthesis, and one-carbon metabolism. 13C enrichments from [13C]Glc in a and b (n = 2–3) were 10–30-fold higher than D enrichment from DSer in CA tissues (**, t = 15.55, p < 0.0001 for ATP; t = 5.466, p = 0.0054), and 2–3.5-fold in matched NC tissues (*, t = 4.466, p = 0.0012 for ATP; t = 5.665, p = 0.0002 for GTP). For GSSG, the 13C/D enrichment ratio in CA tissues was 2–3-fold, respectively, for DGly and DSer (**, t = 15.556, p < 0.0001, and t = 11.314, p < 0.0001), whereas in the NC tissues, this ratio for DGly and DSer was less than 1 (*, t = 4.025, p = 0.0024; t = 3.969, p = 0.0026, respectively). PCNA expression was highest in CA tissues (*, Nprox versus CA t = 2.803, p = 0.049; **, Ndist versus CA t = 3.463, p = 0.026) (d). Similarly, MYC expression was highest in CA tissues (*, Nprox versus CA t = 5.68, p = 0.0047; **, Ndist versus CA t = 7.943, p = 0.0014) (e). Data are means ± S.E., n = 6. Ndist, non-cancerous lung tissue distal (>5 cm) from the tumor margin; Nprox, non-cancerous lung tissue proximal (<1 cm) from the tumor margin.

