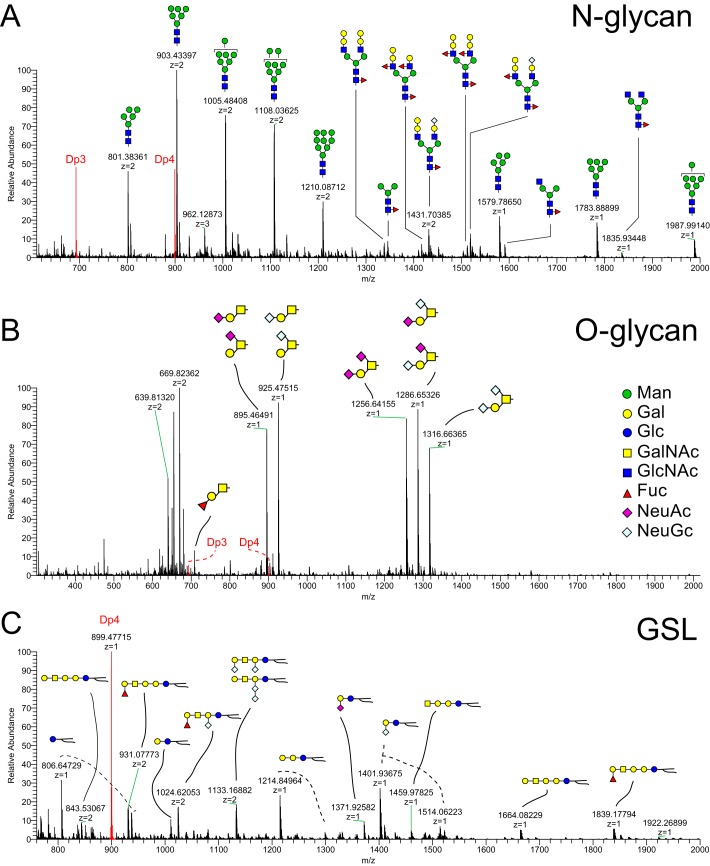
Figure 4.
Profile of N-linked and O-linked glycans and glycosphingolipids in oviduct epithelial cells. Oviduct epithelial cell glycans were analyzed by nanospray ionization linear ion trap and orbitrap MS. Structures of the most abundant glycans are displayed. N-Glycan structures are shown in the top panel (A). Many high-mannose oligosaccharides were detected in lysates of oviduct cells. Most of the N-linked complex-type glycans were capped with galactosyl residues, and many were fucosylated. The most abundant O-glycan structures are presented, many of which were detected as isomeric mixtures (B). Most O-glycans had galactosyl or fucosyl termini. GSL structures are shown in the bottom panel (C). Lewis-type epitopes were not detected among the GSL extracted from oviduct cell lysates. DP3 and DP4, peaks associated with permethylated glycans added as internal standards of equal amount in all three panels. The symbolic nomenclature for glycans is shown in the middle panel.

