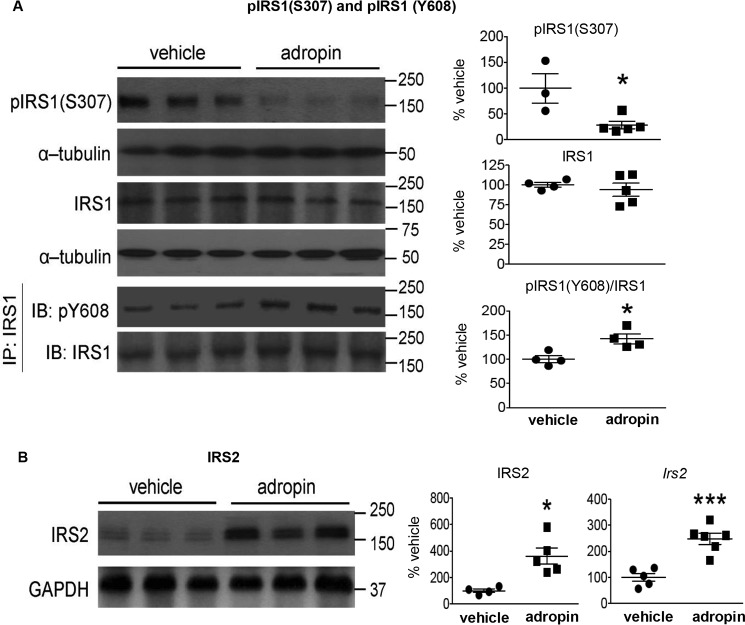
Figure 1.
Adropin34–76 treatment enhanced IRS signaling in the liver. A, the phosphorylation levels of Ser307 in IRS1 (n = 3–5) and total IRS1 protein levels (n = 4–5) as well as the phosphorylation levels of Tyr608 in IRS1 immunoprecipitates (IP) (n = 4) were measured by Western blotting (IB). The Western blotting of the phosphorylation levels of Ser307 in IRS1 were repeated (n = 4–5), and similar changes were detected. α-Tubulin was used as the loading control for pIRS1 (Ser307) and total IRS1. The same α-tubulin band serving as the loading control for total IRS1 was used as the loading control for the blots of pAKT (Ser473) and total AKT (Fig. 2A) and the blots of pIKK (α/β) (Ser176/180) and total IKK (α/β) (Fig. S6). B, IRS2 protein levels (n = 4–5) and message levels (Irs2) (n = 5–6) were determined by Western blotting and RT-PCR, respectively. In Western blotting, GAPDH was used as the loading control for IRS2. The same GAPDH band was used as the loading control for the blots of p-c-Jun (Ser63) and total c-Jun (Fig. 4E) and the blots of pCREB (Ser133) and total CREB (Fig. 8B). *, p ≤ 0.05; ***, p < 0.0005, adropin versus vehicle. Error bars, S.E.

