Figure 3.
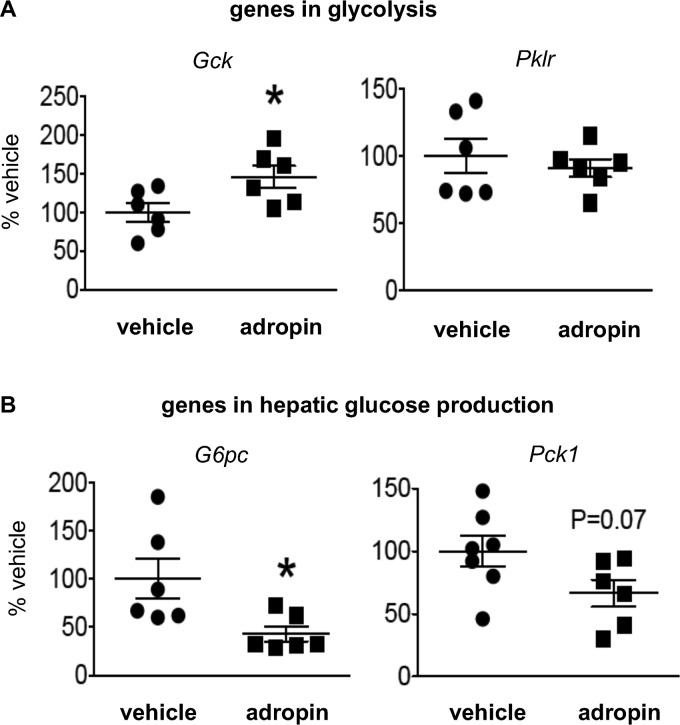
Adropin34–76 treatment altered the expression of glucose metabolic genes in the liver. The message levels of genes in glycolysis (A), including glucokinase (Gck) (n = 6) and liver pyruvate kinase (Pklr) (n = 6), and genes in glucose production (B), including G6Pase (G6pc) (n = 6) and PEPCK-1 (Pck1) (n = 6–7) were determined by real-time RT-PCR. *, p ≤ 0.05, adropin versus vehicle. Error bars, S.E.

