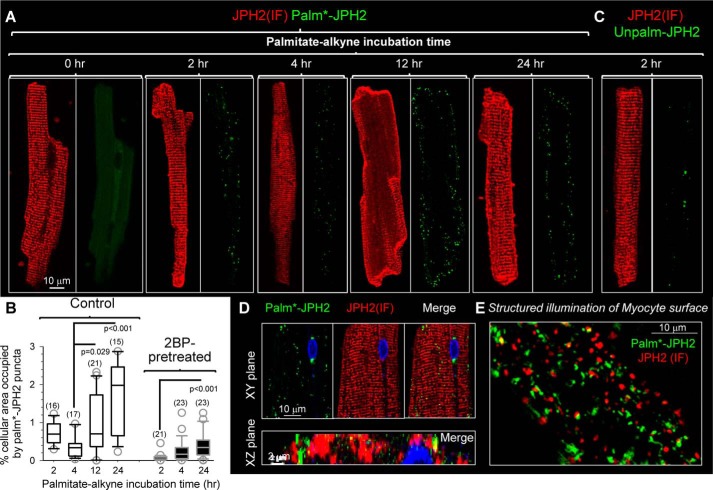
Figure 8.
Native JPH2 in rat ventricular myocytes has slow palmitoyl turnover in the junctional SR–PM junctions. The procedures of detecting Palm–PLA and Unpalm–PLA are described in Figs. S1 and S7, respectively. A, modest increase in palm*–JPH2 signals after palmitate–alkyne incubation from 2 to 24 h. The palm*–JPH2 signals clustered to the lateral cell surface, although JPH2 (IF) confirmed JPH2 localization along the z-line (jSR–PM junctions). The 0-h time point (no palmitate–alkyne incubation) serves as a negative control. Images are shown at the same magnification as the left one with scale bar. B, quantification of palm*–JPH2 signals after specified palmitate–alkyne incubation times under the control conditions or after 2BP pretreatment (100 μm, 2 h). The quantification procedure is described in Fig. S6. Shown are box plots of % cellular area occupied by palm*–JPH2 puncta. Numbers of myocytes analyzed are listed in parentheses. One-way ANOVA p < 0.001, followed by Dunn's all-pairwise tests. Groups showing significant differences are marked. C, Unpalm–PLA procedure detected very few Unpalm–JPH2 signals in myocytes after a 2-h incubation with palmitate–alkyne. D, detection of palm*–JPH2 in cytoplasm along the z-lines. Top, XY plane images from the myocyte center. Bottom, merged image of palm*–JPH2 and JPH2 (IF) in an XZ plane along a z-line. E, structured illumination image of myocyte surface. Both palm*–JPH2 and JPH2 (IF) manifested as distinct puncta with little overlap.

