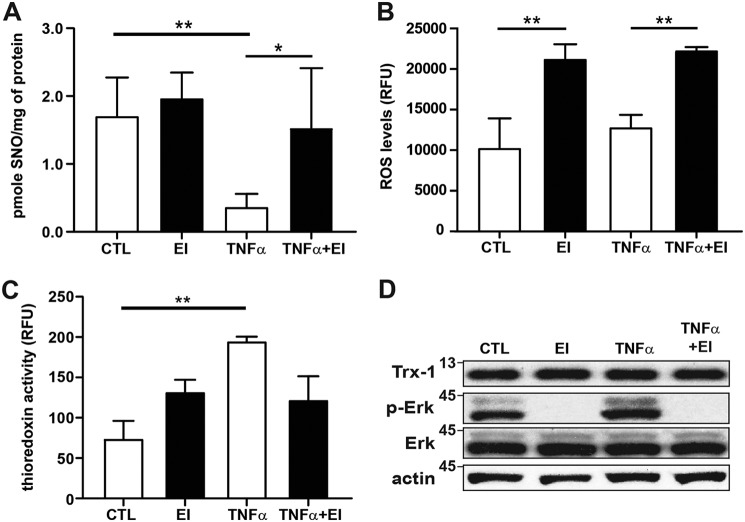
Figure 2.
ERK regulation of Trx activity. A, total SNO quantified by photolysis–chemiluminescence in lysates prepared from A549 cells after TNFα stimulation (10 ng/ml, 60 min) and treatment with ERK1/2 MAP kinase inhibitor (EI) (U0126, 10 μm; n = 5, means ± S.D.). B, intracellular ROS quantified in A549 cells using a fluorescence dye assay (Cellular ROS assay kit; Abcam). The cells were treated with TNFα (10 ng/ml) ± EI (10 μm) for 60 min followed by quantification on a fluorescence microplate reader (relative fluorescence units (RFU); n = 5, means ± S.D.). C, Trx reductase activity quantified by fluorescence assay (Cayman Chemical) in lysates prepared from A549 cells after TNFα stimulation (10 ng/ml, 60 min) and EI treatment (10 μm; n = 3, means ± S.D.). *, p < 0.05; **, p < 0.01. D, Trx1 immunoblots from A549 cells treated with EI and stimulated with TNFα as above. CTL, control.

