Figure 8.
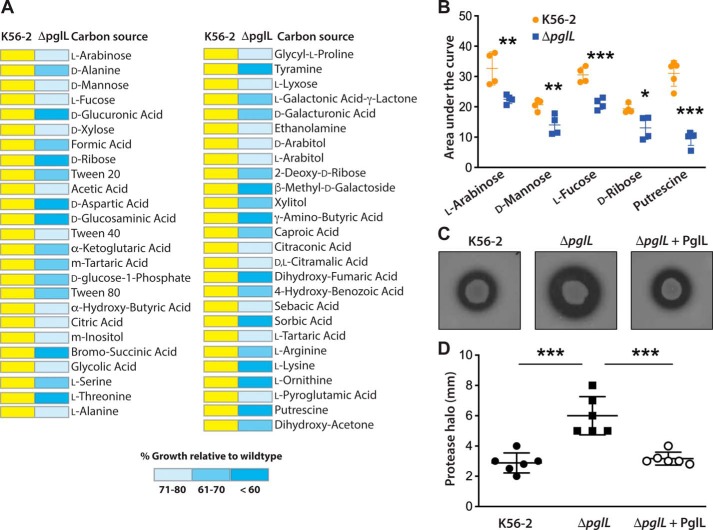
Metabolic alterations in the protein O-glycosylation mutant ΔpglL. A, heat map for carbon source phenotypes as determined by phenotypic microarrays using an Omnilog system (see “Experimental procedures”). Yellow represents WT growth. Blue shading denotes ranges of growth below 80% of the WT growth in the same carbon source, calculated by comparing the area under curve of WT and mutant strain (AUC). The complete results for all carbon sources tested are presented in supporting Data S5. B, selective carbon sources giving differences between K56-2 and ΔpglL were independently validated by generating growth curves measured by the automated bioscreen C using M9 minimal medium with the relevant carbon source under investigation. Statistical differences (mean ± S.D.) of the area under each growth curve were analyzed by multiple t test comparisons with confidence interval of 95%. n = 4 per carbon source. *, p = 0.02; **, p < 0.01; ***, p < 0.001. C, casein proteolytic activity of K56-2, ΔpglL, and the complemented mutant (ΔpglL + PglL) was assayed in casein-containing nutrient agar plates. Plates shown are representatives of at least two experiments done in triplicates. D, quantification of the data in C by measuring the clear halo around the colonies after incubation at 37 °C for 48 h. Values are expressed as mean ± S.D. in millimeters. Statistical differences were analyzed by one-way ANOVA with Tukey's multiple comparisons tests; α = 0.01; ***, p < 0.0001.

