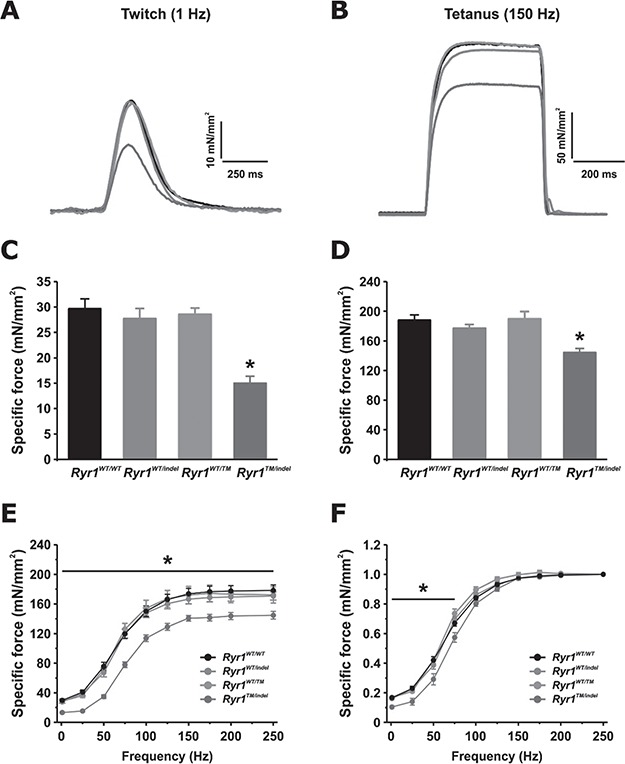
Figure 4.

Reduced twitch and tetanic-specific force production in EDL muscles from Ryr1TM/Indel mice. (A, B) Representative superimposed specific force traces elicited during twitch (A) and tetanic (B) stimulation. (C, D) Average (±SEM) peak twitch (C) and tetanic-specific (D) force for each genotype. (E, F) Analysis of specific (E) and relative (F) force–frequency curves from the same muscles shown in (A)–(D). Number of muscles analysed: Ryr1WT/WT = 12 (6 mice); Ryr1WT/indel = 16 (8 mice); Ryr1WT/TM = 6 (3 mice); Ryr1TM/indel = 8 (4 mice).
