
Figure 5.
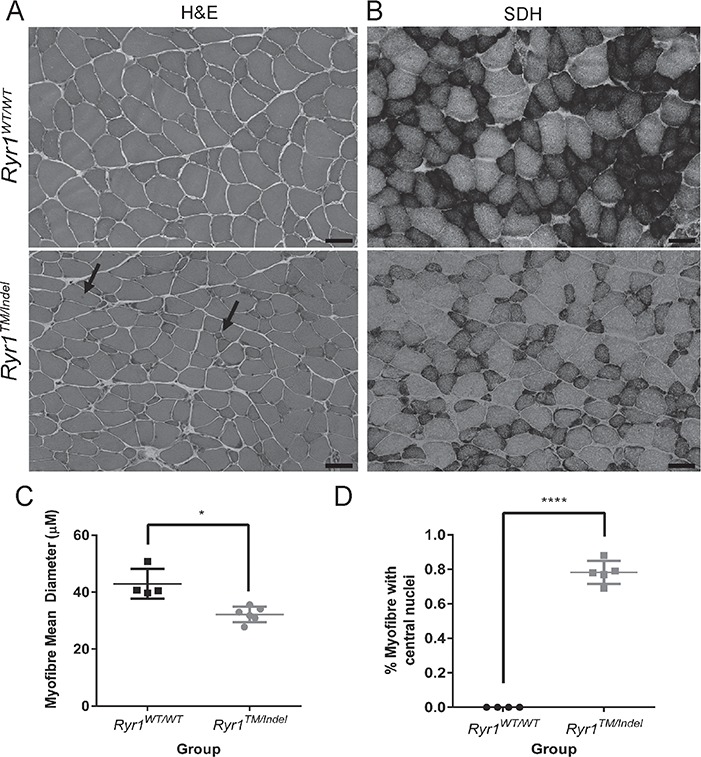
Histological analysis of Ryr1TM/Indel mice reveals reduced myofibre size and increased percent of central nuclei. Histopathologic analysis of cross sections for TA muscle of 55-day-old Ryr1WT/WT and Ryr1TM/Indel mice. (A) As seen with H/E stain, fibres from Ryr1TM/Indel mice compared to Ryr1WT/WT mice exhibit decreased fibre size and reveal the presence of central nuclei. Scale bar is 50 μm. (B) As seen with SDH stain, muscles from Ryr1TM/Indel mice do not exhibit cores or core-like lesions. Scale bar is 50 μm. (C) Mean (±S.E.M.) myofibre diameter of Ryr1TM/Indel (n = 4, male) and Ryr1WT/WT mice (n = 6, 4 male and 2 female). Average fibre diameter is 42.9 ± 2.6 μm versus 32.2 ± 1.1 μm in Ryr1WT/WT and Ryr1TM/Indel mice, respectively (*P = 0.0189). (D) Percent of myofibres containing central nuclei in Ryr1TM/Indel (n = 5) and Ryr1WT/WT mice (n = 5). Average (±SEM) percent central nuclei is 0.00% and 0.78% ± 0.03% in Ryr1WT/WT and Ryr1TM/Indel mice, respectively (****P < 0.0001).