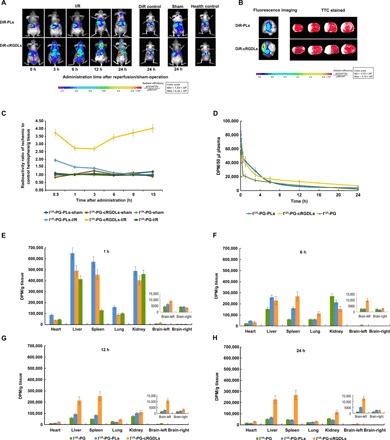
Fig. 3. Multitargeting delivery effect in vivo.

(A) Fluorescence imaging of I/R nude mice after administration of DiR-cRGDLs/DiR-PLs at different times after reperfusion in I/R rat. (B) Coronal sections of TTC stain (white means ischemic area) or fluorescence imaging of I/R nude mice administrated with DiR-cRGDLs or DiR-PLs. (C) Radioactivity ratio of ischemic hemisphere to control hemisphere at different times after administration in I/R rats (n = 5). The bar represents 50 μm. (D) The plasma concentration-time curve and biodistribution (E) to (H) of I125-labeled PLs, cRGDLs, and PG.
