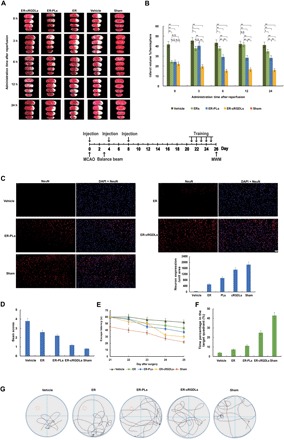
Fig. 5. Pharmacodynamic evaluation on liposome loading with ER in vivo.

(A) Coronal sections stained with TTC of ischemic rats treated with liposomal ER 0, 3, 6, 12, and 24 hours after reperfusion. (B) Quantitative results of infarct volume of various formulations and control group. **P < 0.01 and *P < 0.05; N.S. means no significant difference. (C) Immunofluorescent labeling for NeuN in the cerebral cortex. The bar represents 50 μm. (D) Balance beam score of I/R rats treated with different formulations at 3 hours after reperfusion. (E) Latencies to find the hidden platform in the water maze during five consecutive training days. n = 5. (F) The percentage of time spent in the target quadrant within 60 s in the MWM test. n = 5. (G) Typical traces from a water maze experiment recorder. n = 5.
