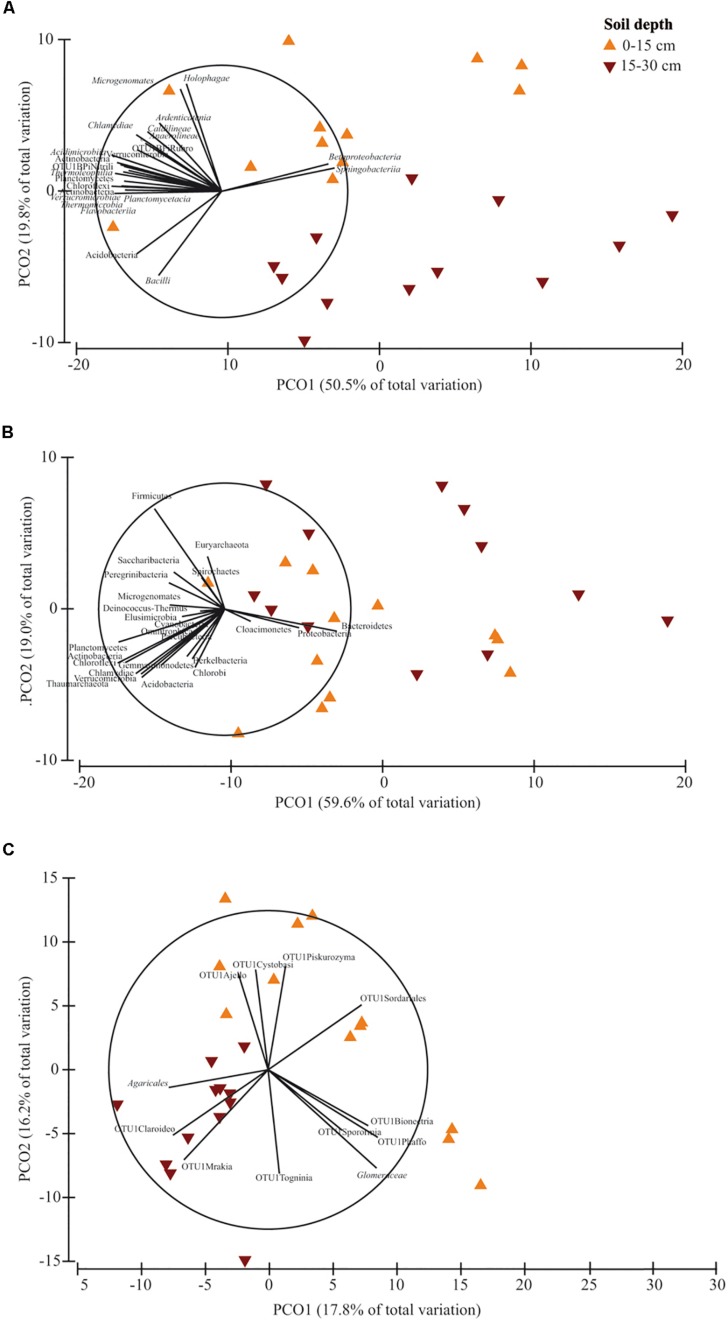
FIGURE 4.
Principal Coordinates Analysis (PCO) biplots on the effect of soil depth (0–15 vs. 15–30 cm) on community diversity of prokaryotic classes (A), prokaryotic phyla (B) and fungal families (C). Tillage and nitrogen fertilization were used as covariates. The output of the subfigures is based on the significant effect of soil depth following the permutational analysis of variance. In each PCO biplot, we displayed only the phyla, classes and families with a strong correlation (r ≥ 0.70) with the ordination scores on each PCO axis. Data standardized to the median were square-root transformed and Bray-Curtis coefficients of similarity were calculated between samples.

