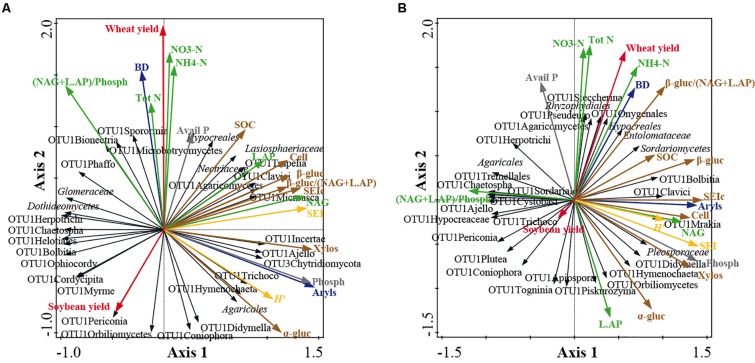
FIGURE 5.
Co-inertia biplots on fungal community structure at family level and soil physico-chemical and enzymatic parameters at 0–15 cm soil depth (A) and at 15–30 cm soil depth (B). See Figures 1B,C and Supplementary Table S2 for fungal taxon assignment. The colored arrows represent the soil parameters: bulk density (BD) and arylsulphatase (Aryls) (blue arrows); wheat and soybean yields (red arrows); P cycle parameters: available P, Avail P; phosphatase, Phosph (gray arrows); N cycle parameters: total N, Tot N; ammonium, NH4-N; nitrate, NO3-N; chitinase, NAG; Leucine, AP, L.AP; ecoenzymatic N/P acquisition activity, (NAG + L.AP)/Phosph (green arrows); C cycle parameters: soil organic carbon, SOC; cellulose, Cell; α-glucosidase, α-gluc; β-glucosidase, β-gluc; xylosidase, Xylos; synthetic enzyme index of C cycle, SEIc; ecoenzymatic C/N acquisition activity, β-gluc/(NAG + L.AP) (brown arrows); enzyme indexes: synthetic enzyme index, SEI; Shannon index, H’ (yellow arrows). The black arrows represent fungal taxa. The lengths of the vector arrows indicate the influence of the parameters on the co-inertia co-structure.

