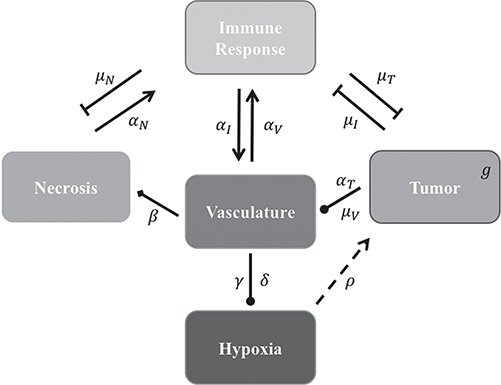
Fig. 3.

Diagram of the model system in which lines ending in pointed arrows represent an increase/recruitment of one component from another and blunted arrows represent a decrease/blockage of one component from another. The dashed line from hypoxia to the tumour represents an enhancement effect on growth (i.e. not recruitment), arrows with a circular end represent mixed effects from one compartment to the next (i.e. positive or negative) and finally the diamond ended arrow from vasculature to necrosis represents the inverse relationship for necrosis production with suboptimal vasculature. Please see Table 2 for a summary of all model variables and parameters.
