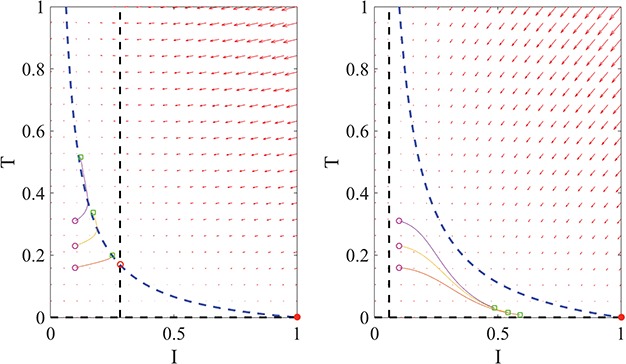
Fig. 4.

Example phase portraits of the system are depicted for two different parameter sets, showing the potential divergence of trajectories (left) or convergence to the steady state (right). Phase field vectors indicate the directionality of trajectories in the field calculated using the defined derivatives for  (tumour) and
  (immune system) ((5.1) and (5.2), respectively). Nullclines from the
  -associated equation ((5.6) and (5.7)), are the vertical and horizontal lines (in black) and for the
  -associated equation ((5.8)), is the remaining dashed curve (in blue). Please see figure online for color. The stable state is represented by a closed red circle and the unstable state with an open red circle. Three trajectories resulting from the model are plotted for each example, where connected with a solid line a pink circle indicates the initial position and a green square the final position. For both examples, the variables
  are fixed at
  and the initial conditions are
  and
and  . Note that the only difference between the two panels is changes in the parameter values. Further notice that, depending on the parameter values of the system, the nullclines shift location, expanding or shrinking the area of the phase space for which model trajectories go to zero for the tumour volume. Parameter values used listed in Table 4: left panel,control values, right panel, treated values.
