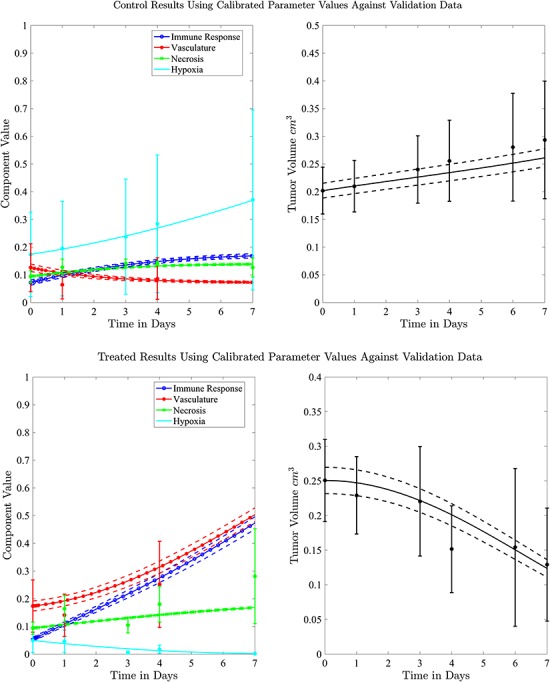
Fig. 6.

Model simulations for the control and treated sets (top panels for control and bottom panels for treated tumours) with 95% confidence intervals indicated with dashed lines are derived from varying initial conditions based on the experimental data using the second set of tumour data. Tumour volume data and model calibration are shown on the right and the tumour biological data are shown in left panels.
