
Fig. 8.
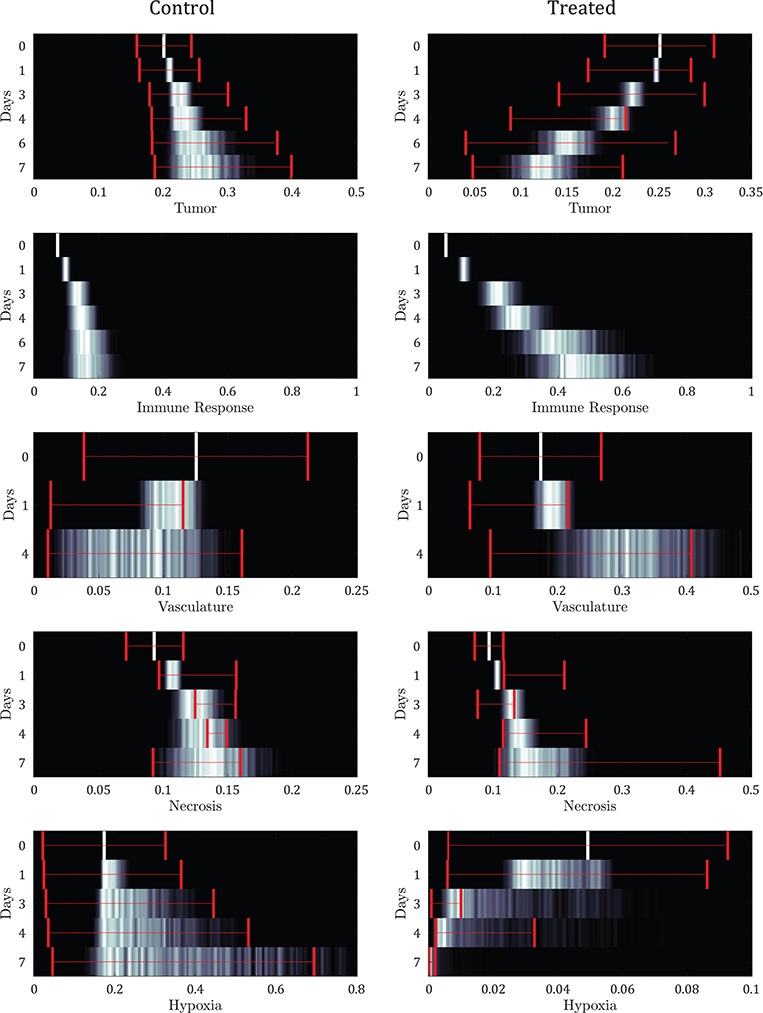
Model output uncertainty depicted as normalized probability heat maps per experimental time (Days) compared to data (where the 95% data confidence interval is overlaid) from variable parameter values using error intervals from the parameter calibration. The immune response component is shown for the experimental time points corresponding to the tumour volume data. Results reveal general agreement between the probable model simulations and the data confidences for both control and treated results.