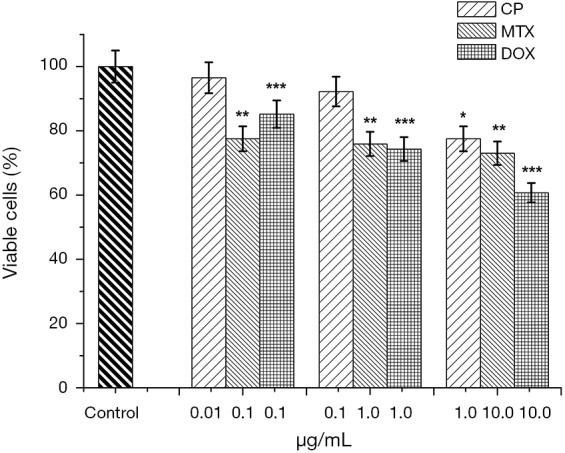
Figure 4.

Bar graphs showing the sensitivity of MCF-7 cells to anticancer drugs in monolayer culture: cisplatin (0.01, 0.1, 1.0 µg/mL), methotrexate (0.1, 1.0, 10.0 µg/mL), doxorubicin (0.1, 1.0, 10.0 µg/mL); MTT test, 48 hours of incubation; *P≤0.05, cisplatin, compare with the control samples, **P≤0.05, methotrexate, compare with the control samples,***P≤0.05, doxorubicin, compare with the control samples.
